When a team discovers an expected staffing shortfall heading toward the horizon, bringing that projection to executive leadership is an essential responsibility. However, a forecast standing on its own rarely reveals the underlying root causes of the gap. When data communicators face the challenge of explaining multiple moving parts—such as overall workforce trends, departmental shifts, and strategic corrections—the temptation to squeeze every single detail, metric, and cross-tabulation into a single chart or slide becomes nearly irresistible.
That exact hurdle surfaced during a recent custom client workshop hosted by Storytelling with Data, where corporate analysts grappled with a dense web of human resources metrics. The organizational team needed to communicate several distinct realities to top executives: that full-time equivalent (FTE) staffing levels were projected to fall significantly below the established operational plan; that a pronounced decline in operations support roles was serving as a major driver behind the overall deficit; and that leadership needed to actively engage in a strategic discussion regarding how to resolve the widening gap.
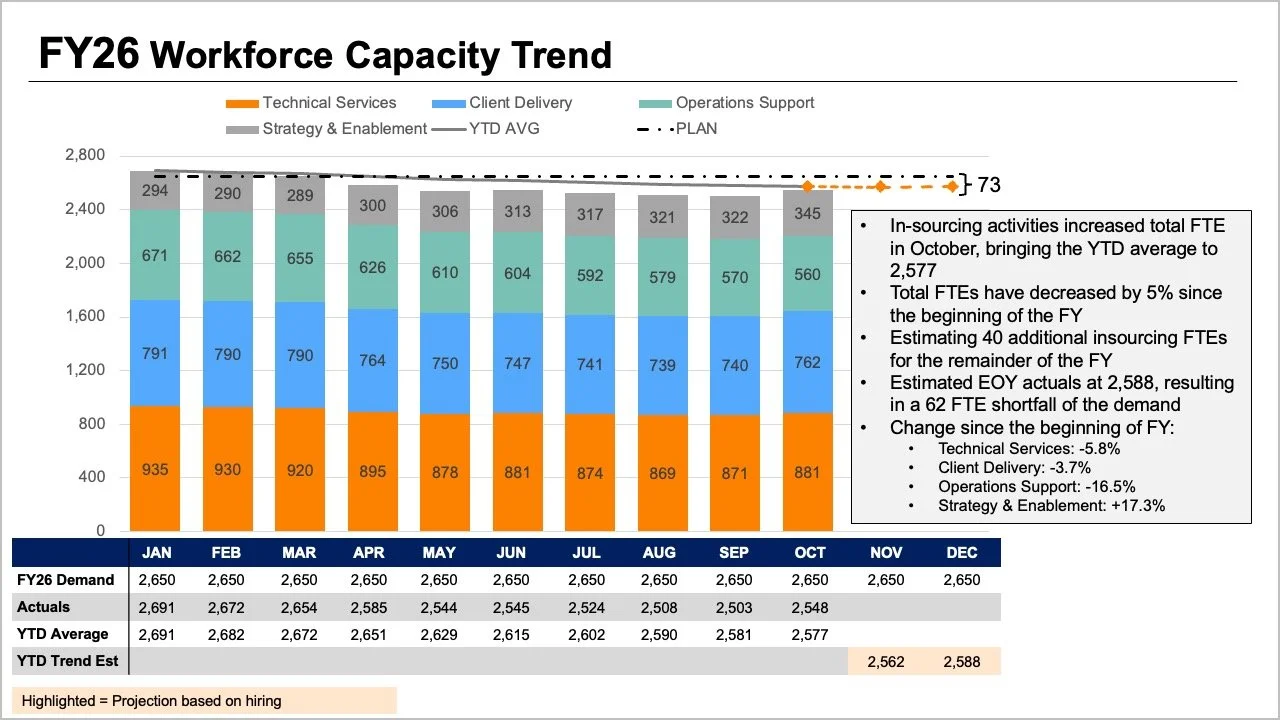
While all the vital information was technically present within the team’s initial reporting materials, the core narrative was buried beneath layers of visual complexity. The original slide demanded that readers process multiple graphical elements simultaneously. The tops of stacked bars, overlapping trend lines, and dense data tables attempted to convey overall FTE figures in several competing ways at once. Meanwhile, individual segments within the stacked bars tried to illustrate a granular breakdown by specific job roles, while shifting baselines encompassing plans, actuals, year-to-date averages, and forward-looking projections added yet another complex layer of interpretation.

Every single visual element on that crowded slide answered a perfectly reasonable and valid question. Yet, when crammed together into a single confined space, they actively hindered the audience’s ability to answer any single question well. By taking a deliberate step back to evaluate what executives actually required for the strategic conversation ahead, the analysts found a clearer path forward. Leadership did not need to decode a labyrinth of intersecting variables at a single glance; instead, they needed direct answers to two fundamental questions: How large of a staffing shortfall should the organization realistically anticipate, and what do the most recent staffing metrics reveal about where the shifts have actually occurred?
Rather than continuing to pack every available data point into one overloaded graph, the team realized the solution lay in separation, dividing the information into distinct visual components tailored to specific inquiries.
Shifting to a Line Chart for the Overall Trend
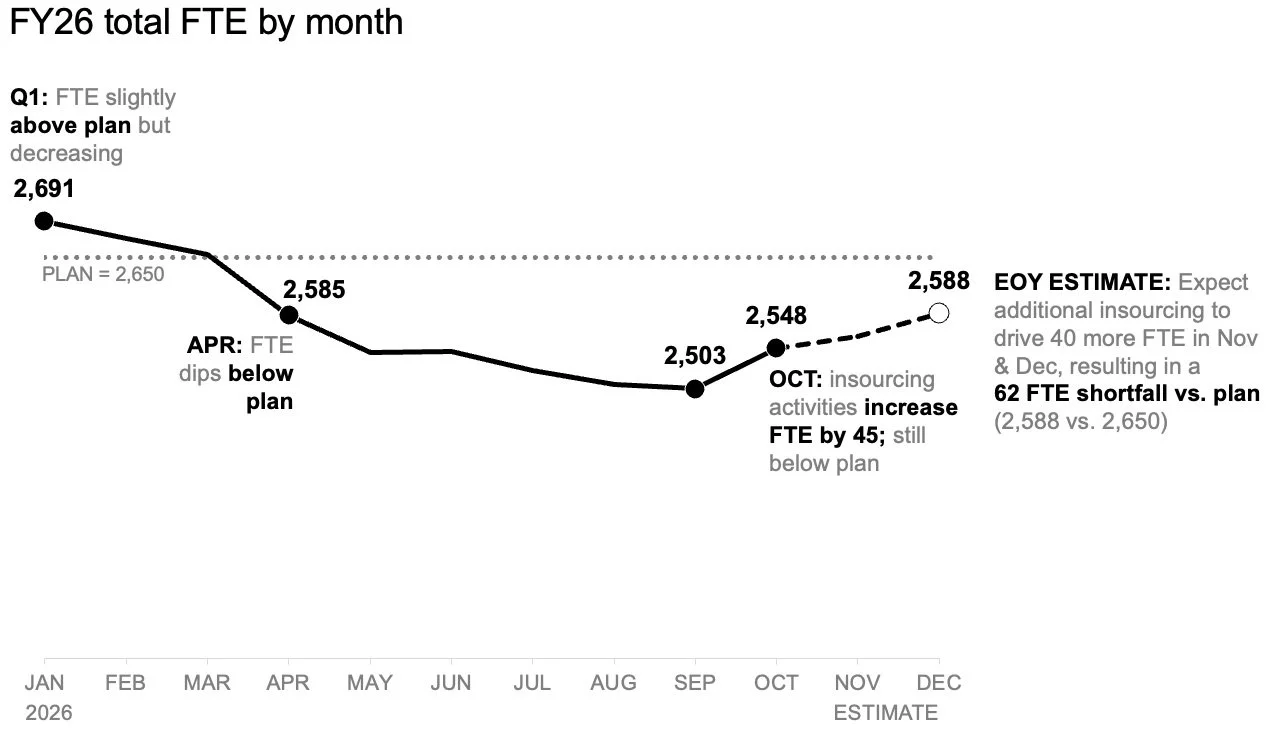
To tackle the challenge of illustrating the anticipated workforce shortfall, the communications team looked first at establishing a clean baseline for the overall trajectory. A standalone line chart offers a far more effective medium for tracking how actual staffing levels have measured against the baseline plan established at the beginning of the fiscal year, while simultaneously showing how future forecasts compare to those initial targets.
This simplified view provides ample open space to incorporate targeted annotations at critical inflection points along the timeline. Instead of struggling to decode a complex role mix or scanning back and forth across an exhaustive data table, readers can focus immediately on the expected gap to plan. By stripping away visual clutter, the primary trend emerges with unmistakable clarity, allowing executives to grasp the scale of the upcoming challenge without unnecessary cognitive friction.
Adding a Second View for the Role-Level Breakdown
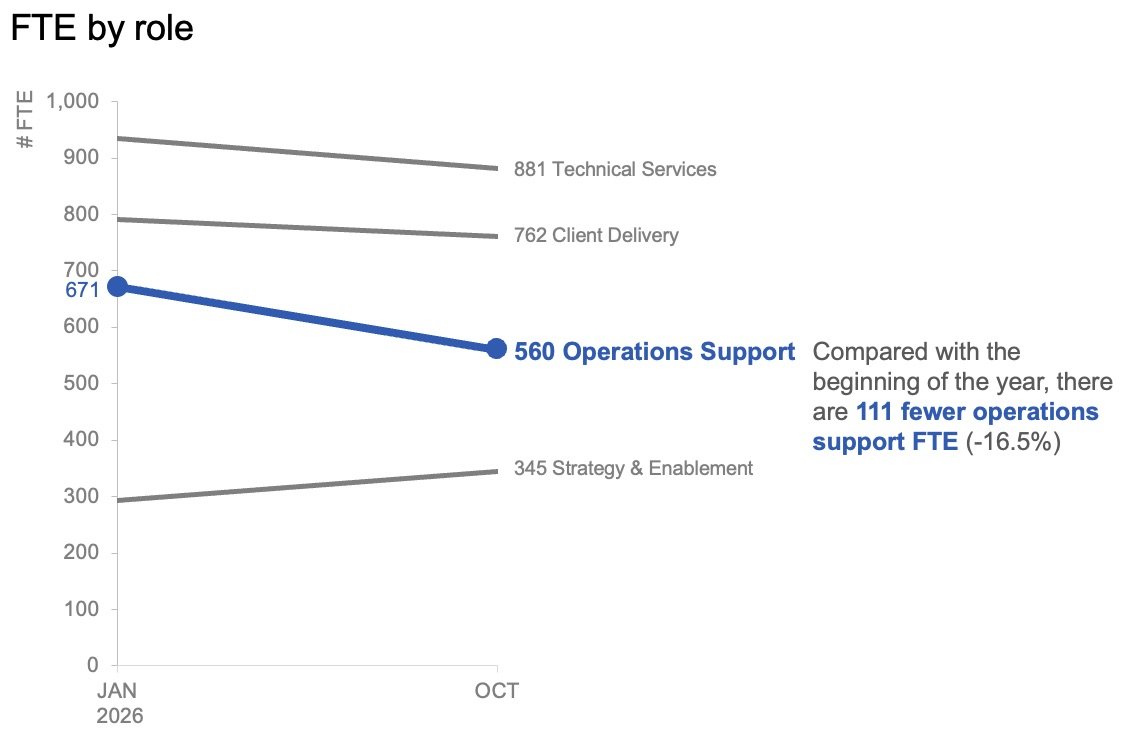
Once the overall trend establishes the expected variance from the organizational targets set at the start of the year, the conversation naturally shifts toward diagnosis. To help leadership understand where the largest workforce shifts have actually occurred, a secondary view focusing on role-level changes in the actual data becomes necessary.
In examining granular role data, short-term month-to-month variations often introduce noise that distracts from the broader reality. By plotting only the baseline figures from the start of the year alongside the latest actual month using a specialized slopegraph, analysts can provide decision-makers with an immediate, intuitive sense of which specific roles have experienced the most dramatic changes. Applying color and explanatory text with strict economy directs immediate attention toward the notable decline in operations support roles, ensuring the audience spots the primary driver of the deficit without having to hunt for it.
These two distinct visuals ultimately function as a powerful complementary pair. The line chart answers the macro-level question of what is happening across the entire organization, while the slopegraph answers the micro-level question of which specific roles have shifted most drastically so far.
Planning How the Narrative Will Be Shared Across Formats
The method of delivering these insights depends heavily on the medium through which the story is consumed. For a written summary report that might be reviewed asynchronously or forwarded independently without a presenter walking through the slides, placing both analytical views together on a single page creates a comprehensive reference document. A strong, takeaway-driven slide title can state the expected shortfall directly, while concise supporting text points to the contraction in operations support roles and signals that leadership must deliberate on immediate next steps. The accompanying charts provide robust empirical evidence without competing for visual dominance.
For a live, in-person presentation, however, the same underlying data can be deployed through a more dynamic pacing strategy. Rather than demanding that an audience absorb an entire summary snapshot all at once while a speaker talks over the slide, presenters can walk through the macro-level forecast first, reveal the actual role-level shifts piece by piece, and finally pivot the room’s attention toward a collaborative discussion on required corrective actions. This intentional sequence allows stakeholders to fully digest one conceptual point before transitioning smoothly to the next.
While the underlying data and the core message remain entirely consistent across both formats, the fundamental variable that changes is the pacing of information consumption.
Giving Each Strategic Question Its Own Dedicated View
When organizations face complex operational challenges, the impulse to aggregate every related metric into a single, comprehensive dashboard or slide often masquerades as efficiency. Yet, simply packing more information into a presentation does not automatically translate into deeper understanding or more effective decision-making.
By separating the broader macroeconomic trend of overall FTE trajectories from the granular, role-level changes occurring beneath the surface, the updated reporting approach transformed a confusing report into an actionable executive briefing. Together, these focused visual components deliver a sharp, coherent narrative that equips leadership with the clarity needed to address workforce challenges head-on.