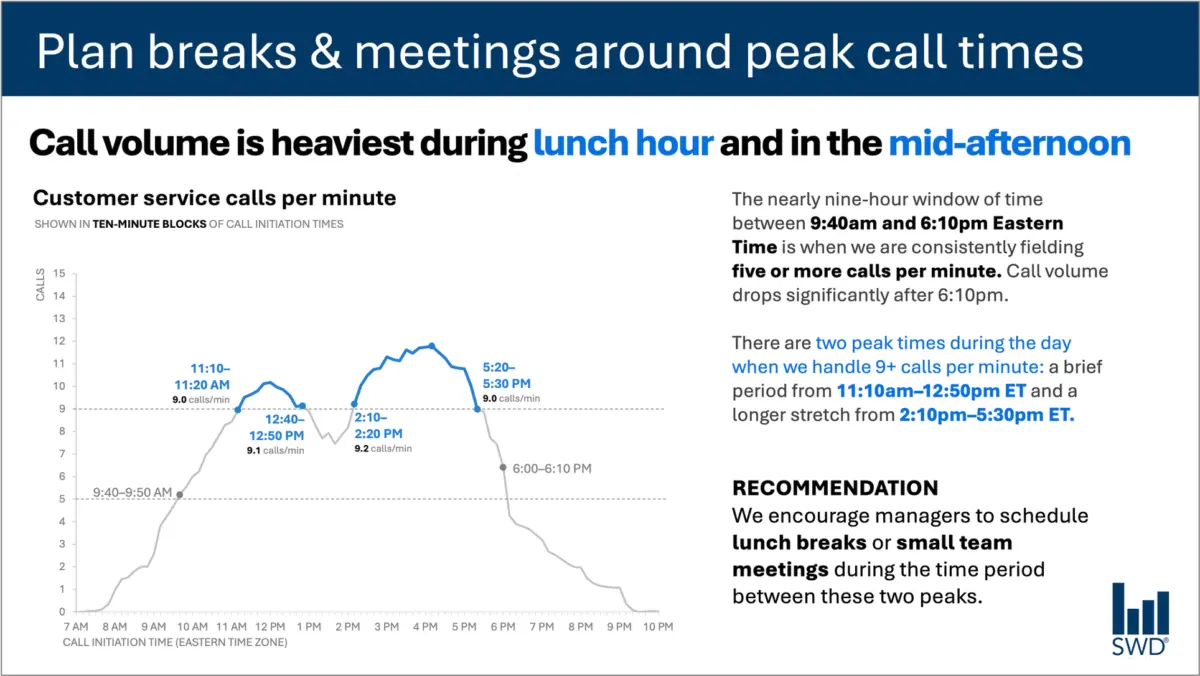
When a staffing manager opens a report and looks at a graph charting customer service call volumes throughout the day, the data tells a clear and immediate story. The lines climb steadily in the morning, remain consistently high through the core hours of the workday, and form two distinct peaks—one around lunchtime and another in the mid-afternoon.
Viewed in a vacuum, the graph is simply a visual representation of operational patterns. But the audience reviewing the visualization is not looking at it out of casual curiosity. They are staffing managers, and the data is being presented to them because they have the power to act on it.
That fundamental shift in context changes everything about how the information should be communicated. A minimalist approach might strip away all surrounding text to leave the graph clean and uncluttered, but minimalism for its own sake often strips away utility. In professional communication, the goal is not merely to reduce words until none are left, but to deploy the right words to ensure the data becomes actionable.
Different Words Do Different Jobs
Communication experts emphasize that when deciding which elements belong on a slide or within a data visualization, creators must first analyze what the audience actually needs from those words. Every piece of text integrated into a graphic has a specific function, and confusing those functions can lead to misinterpretation or missed opportunities for action.
A takeaway title, for instance, is designed to communicate the main point or necessary action directly to the viewer. In the case of the call-volume graph, a title such as Plan breaks and meetings around peak call times instantly signals to staffing managers what matters most. Meanwhile, a descriptive graph title—such as Customer service calls per minute—serves an entirely different purpose by orienting the audience and establishing precisely what they are looking at.
Other textual elements play equally vital roles. Direct labels can eliminate the cognitive friction of forcing a viewer to look back and forth between the data lines and a separate legend. Annotations can explain historical anomalies, call attention to critical thresholds, or add qualitative context that is entirely invisible within the raw numbers alone. Traditional elements like axis titles, footnotes, and source information provide the necessary granular detail when deeper verification is required.
Crucially, not every graph requires every single one of these components. The objective is intentionality. Communicators must ask what their audience needs in order to truly understand the data, what those viewers should know or do as a result of seeing it, and where a few well-chosen words can eliminate confusion or make an underlying point unmistakable. Once those questions are answered, any remaining text that fails to serve a distinct purpose can be safely discarded.
The Insight Has to Come from Somewhere
This delicate balance between data and narrative is where the human role becomes irreplaceable, particularly in an era of increasingly sophisticated artificial intelligence tools.
Consider what happens when an AI system is handed raw customer service call-volume data and tasked with designing a presentation slide. The technology is remarkably adept at identifying underlying statistical patterns. It can readily determine that call volumes surge around lunchtime and spike again in the mid-afternoon, and it can effortlessly generate a polished, grammatically correct sentence describing that observation.
However, a polished description is not yet an insight.
A truly useful recommendation requires combining raw data with deep organizational context. An AI model analyzing numbers in isolation does not inherently know who the audience is, why they are reviewing the visualization, what operational constraints they face, or what management decisions fall directly within their control. Once a human establishes that the audience consists of staffing managers responsible for shift scheduling, the raw statistical pattern transforms into an actionable directive, such as scheduling lunch breaks or team meetings during the lulls between the peaks.
This principle forms the foundation of modern data storytelling frameworks. Before asking automated systems to assist with communication tasks, human analysts must provide the necessary context. While AI can undoubtedly help find concise phrasing, suggest alternate titles, draft data labels, and test different ways of articulating an idea, it requires a human operator who understands the operational environment well enough to recognize what truly matters.
A polished sentence cannot substitute for genuine human insight. Professionals who spend their days working closely with operational data possess institutional knowledge that technology cannot replicate. They understand the historical context, the recent policy changes, the underlying organizational dynamics, and the specific concerns of their stakeholders. They know which minor fluctuation on a chart is merely statistical noise and which movement signals a critical operational bottleneck.
By bringing that tacit knowledge to the visualization process, communicators can use language to make their strategic thinking visible. The ultimate measure of effective data design is neither an excess of verbose explanations nor an austere minimalism that leaves viewers guessing. Success lies in choosing the right words to do the right jobs, transforming cold statistics into clear, actionable understanding.