In an era dominated by data, maps have evolved far beyond basic instruments used solely for navigation and orientation. While traditional reference maps remain essential for locating cities, roads, rivers, and political boundaries, another specialized category of cartography plays a crucial role in analyzing complex information: the thematic map.
Thematic maps are designed to visually communicate data tied to specific subjects or phenomena across geographic space. Rather than presenting a general overview of physical features, a thematic map focuses on a single narrative or topic—ranging from population density and climate variations to economic activity and public health trends. By synthesizing raw data into intuitive visual formats, thematic maps transform abstract numbers into readable spatial patterns, helping geographers, analysts, and policymakers make informed decisions.
Defining the Thematic Map: Purpose and Importance
A thematic map is a specialized map that emphasizes the spatial distribution of a particular topic or attribute across a defined geographic area. Unlike general reference maps, which prioritize structural topography and navigational landmarks, thematic maps use visual markers such as color gradations, scaled symbols, line contours, or custom shading to highlight structural patterns, trends, and anomalies within data sets.
The core purpose of a thematic map is effective spatial communication. Tabular data, spreadsheet figures, and statistical outputs can often mask underlying spatial relationships. When mapped, however, geographic correlations become immediately apparent. For instance, an analyst viewing raw environmental figures might miss localized trends, whereas a thematic map instantly highlights how precipitation levels vary dramatically across neighboring agricultural sectors or how rising temperatures affect regional yields.
The importance of thematic mapping lies in its versatility and clarity. For students and researchers, thematic maps clarify complex theoretical concepts in physical and human geography. For government officials and urban planners, these maps provide evidence-based visualizations required for resource allocation, zoning decisions, emergency management, and transit development. In commercial sectors, thematic maps enable market researchers to evaluate demographic shifts, identify business expansion zones, and assess economic spatial dynamics.
Types of Thematic Maps
Depending on the nature of the underlying data—whether continuous, discrete, categorical, or numerical—cartographers employ several distinct types of thematic maps to portray information accurately.
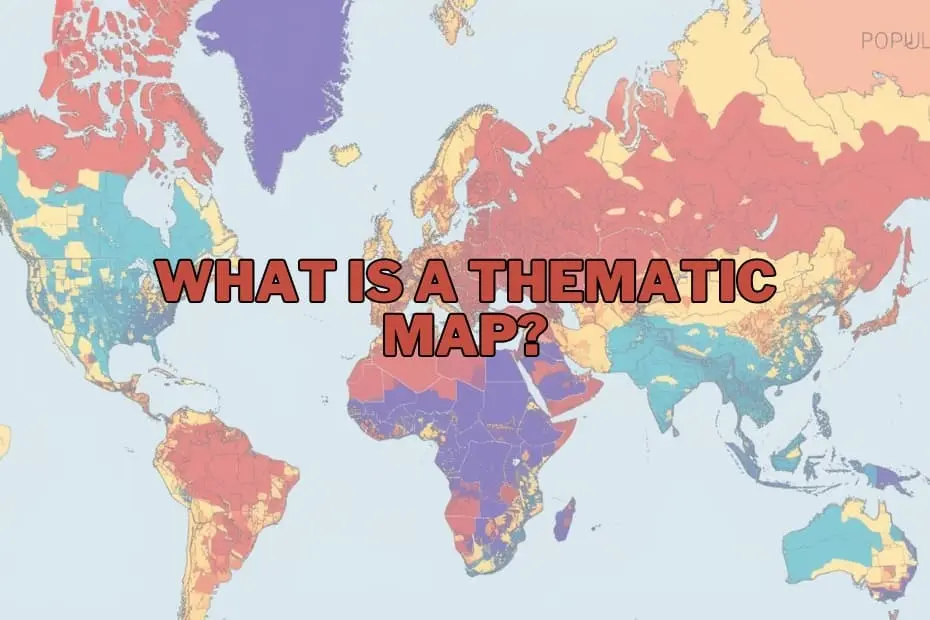
- Choropleth Maps: Among the most common thematic visualizations, choropleth maps apply varying shades of color or patterns to predefined spatial units, such as countries, states, counties, or zip codes. The intensity of the color corresponds to the magnitude of the statistical variable being measured, such as population density, literacy rates, or median household income.
- Isoline (Isarithmic) Maps: Isoline maps use continuous lines to connect points of equal value across a geographic surface. These maps are particularly suited for visualizing continuous spatial phenomena that lack rigid administrative boundaries. Common examples include topographic contour maps, isotherm maps showing equal temperatures, and isohyets displaying precipitation levels.
- Proportional (Graduated) Symbol Maps: Proportional symbol maps feature shapes—most frequently circles—placed at specific geographic points or within defined regions. The size of the symbol scales proportionately with the data value it represents. This technique is frequently used to display variables like traffic volume at intersections, city populations, or total industrial output by location.
- Dot Density Maps: Dot density maps represent quantitative data by placing dots or points across a region, with each dot corresponding to a pre-set unit value of a variable (such as one dot representing 1,000 residents). These maps effectively convey visual density and spatial distribution without relying on rigid color blocks.
- Cartograms: Cartograms intentionally distort geographic shapes, land areas, or distances based on the thematic variable being measured. For example, a population cartogram resizes countries relative to their total population rather than their physical land area, providing an immediate visual impact regarding global demographics.
Key Elements of a Thematic Map
To effectively communicate data without misleading the reader, a thematic map must incorporate several essential design elements:
- Clear and Informative A precise title sets the context of the map by identifying the specific theme, geographic scope, and time period covered.
- Legend (Key): The legend decodes the visual symbols, colors, shading intervals, or dot values used on the map, allowing readers to convert visual cues back into quantitative or categorical data.
- Map Scale: Whether presented as a scale bar, ratio, or verbal statement, the scale helps the user understand spatial proportions and measure geographic distances accurately.
- Orientation Indicator: A compass rose or north arrow ensures proper spatial orientation, helping users contextualize the direction and layout of the geography.
- Data Source Attribution: Citing credible data sources ensures transparency, verifies accuracy, and maintains academic and professional integrity.
- Data Classification Scheme: For quantitative maps, how data is broken into ranges or classes (such as equal intervals or natural breaks) directly affects visual interpretation and must be chosen thoughtfully.
Applications of Thematic Maps
The utility of thematic mapping spans across numerous disciplines and industries, serving as a foundational tool for visual analysis:
- Public Health and Epidemiology: Public health officials use thematic maps to track disease outbreaks, map infection rates across communities, analyze mortality patterns, and identify areas lacking access to healthcare facilities.
- Environmental Science and Climatology: Environmental researchers rely on thematic maps to visualize climate change impacts, track deforestation, monitor air and water quality indices, and model natural hazard risks such as flood zones and wildfire patterns.
- Urban Planning and Infrastructure: City planners utilize thematic maps to assess housing density, optimize public transportation routes, monitor land-use changes, and design municipal zoning policies.
- Economics and Business Strategy: Corporate analysts and economists employ thematic maps for market segment analysis, evaluating regional purchasing power, determining ideal site selection for new stores, and tracking supply chain distribution networks.
- Demographics and Sociology: Demographers use thematic mapping to examine population growth rates, migration pathways, racial and ethnic distributions, and educational attainment levels over time.
Advantages of Thematic Maps
Thematic maps offer distinct benefits that make them indispensable across research and industry:
- Simplification of Complex Data: They condense dense statistical datasets into accessible, easily digestible visual representations.
- Pattern Recognition: By framing information spatially, thematic maps expose spatial clusters, regional disparities, and spatial outliers that remain hidden in standard tables.
- Enhanced Decision-Making: Visual clarity enables decision-makers to evaluate scenarios quickly, assign resources efficiently, and formulate evidence-based policy.
- Versatility: Thematic maps can adapt to virtually any subject matter, supporting diverse fields ranging from historical research to real-time meteorological forecasting.
Limitations of Thematic Maps
Despite their effectiveness, thematic maps present specific limitations and potential pitfalls that mapmakers and readers must navigate:
- Risk of Misinterpretation: Poor map design, inappropriate data classification intervals, or misleading color choices can distort facts and misinform audience perceptions.
- Generalization and Data Smoothing: Aggregating data within broad administrative boundaries (as seen in choropleth mapping) can conceal local variations and micro-trends, leading to oversimplification.
- Dependence on Data Quality: A thematic map is only as reliable as its underlying data; inaccuracies or gaps in the dataset directly undermine the map’s validity.
- Spatial Distortion: Certain thematic formats, such as cartograms, intentionally warp geographic real estate, which can confuse viewers unfamiliar with basic geography.
Tools and Software for Creating Thematic Maps
Advancements in digital cartography and Geographic Information Systems (GIS) have made thematic map creation more accessible than ever. Modern software suits range from professional spatial mapping platforms to intuitive data visualization packages:
- Professional GIS Software: Platforms like Esri ArcGIS Pro and the open-source QGIS provide comprehensive suites for performing advanced spatial analysis, managing complex datasets, and drafting precise thematic maps.
- Data Visualization Software: Business intelligence tools such as Tableau, Power BI, and specialized Python/R mapping libraries allow users to generate clear thematic visualizations alongside corporate analytical dashboards.
- Web-Based Mapping Applications: User-friendly platforms such as Mapbox, Carto, and Google Data Studio offer web cartography tools tailored for interactive storytelling and digital publishing.
FAQs: What is a Thematic Map?
What is the difference between a thematic map and a reference map?
A reference map focuses on displaying general geographic features, location details, and physical landmarks such as roads, rivers, mountains, and municipal boundaries. In contrast, a thematic map focuses on a specific subject, theme, or dataset, using cartographic techniques to highlight spatial distributions and trends related to that topic.
Can thematic maps be used for historical data?
Yes, thematic maps are highly effective for visualizing historical datasets. They allow researchers to map historical trends, such as demographic shifts, historical trade routes, territorial changes, or agricultural transformations across different historical eras.
What software is best for beginners to create thematic maps?
For beginners looking for free and open-source tools, QGIS offers powerful mapping capabilities supported by extensive community tutorials. For non-GIS specialists focusing primarily on business graphics and user-friendly visual interfaces, platforms like Tableau or web-based mapping applications provide intuitive entry points.
How do I choose the right type of thematic map for my data?
Choosing the correct map type depends on the structural nature of your data. Continuous physical phenomena (such as temperature or elevation variations) are best represented using isoline maps. Aggregated quantitative data linked to administrative units (such as state-by-state population density) works best with choropleth maps, while point-specific point distributions suit dot density or proportional symbol maps.
Are thematic maps only used in geography?
No. While rooted in cartographic science, thematic maps are extensively utilized across public health, environmental monitoring, urban planning, corporate business analysis, real estate, politics, and sociology to visualize and communicate spatial patterns within domain-specific data.