Data visualization remains one of the most critical elements in effectively communicating complex information, yet finding the right visual format for a dataset is rarely a straightforward path from an initial idea to a polished graphic. Traditional workflows often involve building a chart, realizing it highlights the wrong aspects of the data, and starting over. Today, however, professionals are increasingly turning to artificial intelligence to accelerate this iterative process, allowing them to rapidly prototype different views of the same data and evaluate options before committing to a final build.
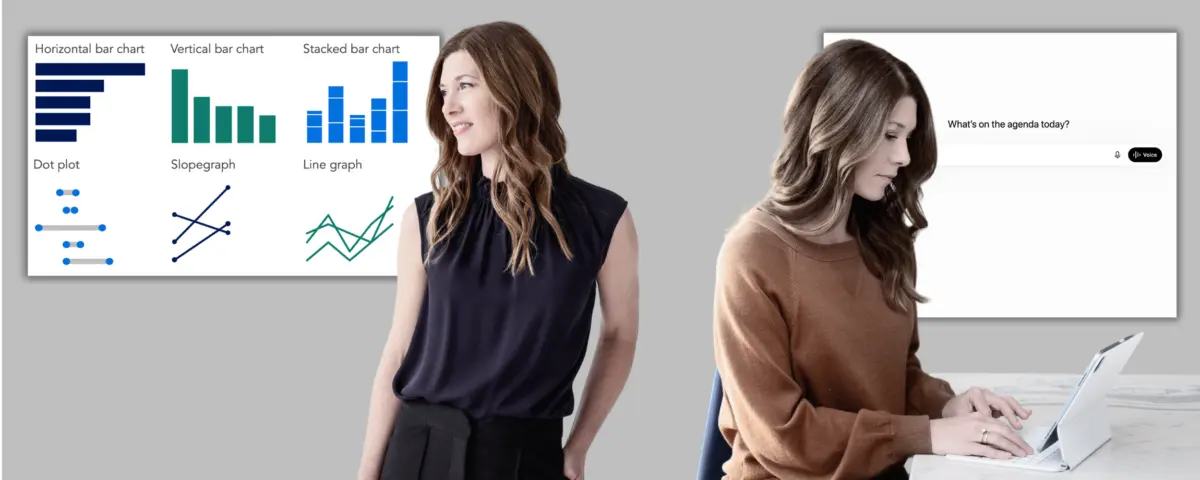
Understanding the fundamental purpose of different chart types remains essential when evaluating AI-generated options. Standard formats serve distinct analytical functions: bar charts compare data across categories, while dot plots and slopegraphs emphasize changes between two specific points. Line graphs remain the standard for showing trends over time. When in doubt, familiar designs usually work best because an audience should never have to learn how to read a graph before they can understand the underlying message. Unfamiliar or novel visualizations should only be utilized when they reveal a critical insight that would otherwise remain obscured.
The integration of artificial intelligence into the data visualization workflow offers a structured way to navigate these choices. If a presenter is following a structured storytelling framework, the key takeaway titles established during the storyboarding phase already outline the core message. For those approaching the task independently or operating in an exploratory mode, AI can assist in surfacing patterns and trends worth highlighting from a raw dataset. Once an interesting trend emerges, articulating the core takeaway is crucial before moving into prototyping. That articulation step turns a raw prototype into a purposeful, audience-focused visual.
From there, the workflow involves sharing the data with the AI tool, communicating the primary message, and requesting a range of visualization options. Analysts do not need to spend time cleaning or aggregating data beforehand, as handling that preparation is part of what modern AI can assist with. For each proposed prototype, users can ask the AI to explain the trade-offs—specifically detailing what each option makes easy to see and what it obscures. The goal is not to delegate the final decision to the algorithm, but rather to quickly surface viable options that can be evaluated using professional judgment, audience awareness, and project goals.
Once a clear direction is established, the chart can be built either independently or with the assistance of built-in AI features within standard design tools. Regardless of the method used, the creator remains entirely responsible for the accuracy and integrity of the data shown.
Working with AI: Choosing an Appropriate Visual
Tool capabilities, however, vary significantly across different platforms and account tiers. While any major tool can assist with the initial planning and strategic thinking steps, visual prototyping requires a platform capable of rendering actual chart images. Even with advanced tools, generating actual images instead of text-based approximations often requires multiple prompts.
In practical testing across popular platforms, Copilot and the free version of ChatGPT frequently struggle to render usable chart images for visual comparison, whereas the free versions of Gemini and Claude generally produce stronger results. Because these capabilities are evolving rapidly, user experiences may differ as underlying technologies improve. Paid tiers consistently yield the strongest results overall, making them worthwhile for professionals with access. For those relying on free options, Gemini currently stands out as a reliable choice among tested platforms. Analysts looking to maximize their options can even input the same prompt across multiple tools to generate a diverse set of approaches for comparison and iteration.
When crafting a prompt for visual selection, establishing context is vital. If continuing an ongoing conversation that previously covered context and narrative structure, the background is already established. For a new conversation, a brief orientation—describing the audience and the core message—ensures the AI understands the parameters. A comprehensive prompt typically outlines the audience, the specific takeaway to display, the context of how the graph will be used, and the raw dataset, while explicitly asking for two to three rendered chart options along with an analysis of their trade-offs.
In Practice: A People Analytics Case Study
To see how this process operates in a real-world scenario, consider the case of a People Analytics Manager at a mid-sized consulting firm. The team recently completed a comprehensive analysis of the company’s hybrid work policy, evaluating performance ratings, in-office attendance patterns, collaboration network data, and attrition trends. The resulting recommendation is clear: transition away from a rigid three-days-in-office, two-days-remote policy for all employees, moving instead toward a differentiated approach based on specific roles and team types.
Having established the context and narrative arc in previous stages of the project, the analytics manager reached the phase of creating individual graphs to support specific slides in the presentation. Two distinct graphs were developed using different AI platforms to evaluate their outputs. For the first graph—illustrating how early-tenure attrition has increased since the implementation of the hybrid policy—Gemini was utilized due to its strong performance among free tiers.
Using a structured prompt tailored to an audience of leadership team members with divided opinions, the manager provided a summary data table showing pre- and post-hybrid attrition rates categorized by role type and tenure. Before generating visual options, the AI asked several clarifying questions to better understand the proposed differentiated policy, potential sources of leadership pushback, and whether the executives preferred traditional graph formats.
After addressing these points, the AI presented three distinct visual options: a slopegraph, a grouped bar chart, and a dumbbell graph. The system also explained its strategic use of color, employing neutral gray to represent the baseline period before the policy implementation as well as mid- and senior
-tenure segments where no dramatic shifts occurred, while using a striking red to draw immediate attention to the post-policy spike in early-tenure attrition. Through this collaborative prototyping process, the analytics manager was able to quickly evaluate multiple visualization paths and select the most persuasive format to support the strategic recommendation.