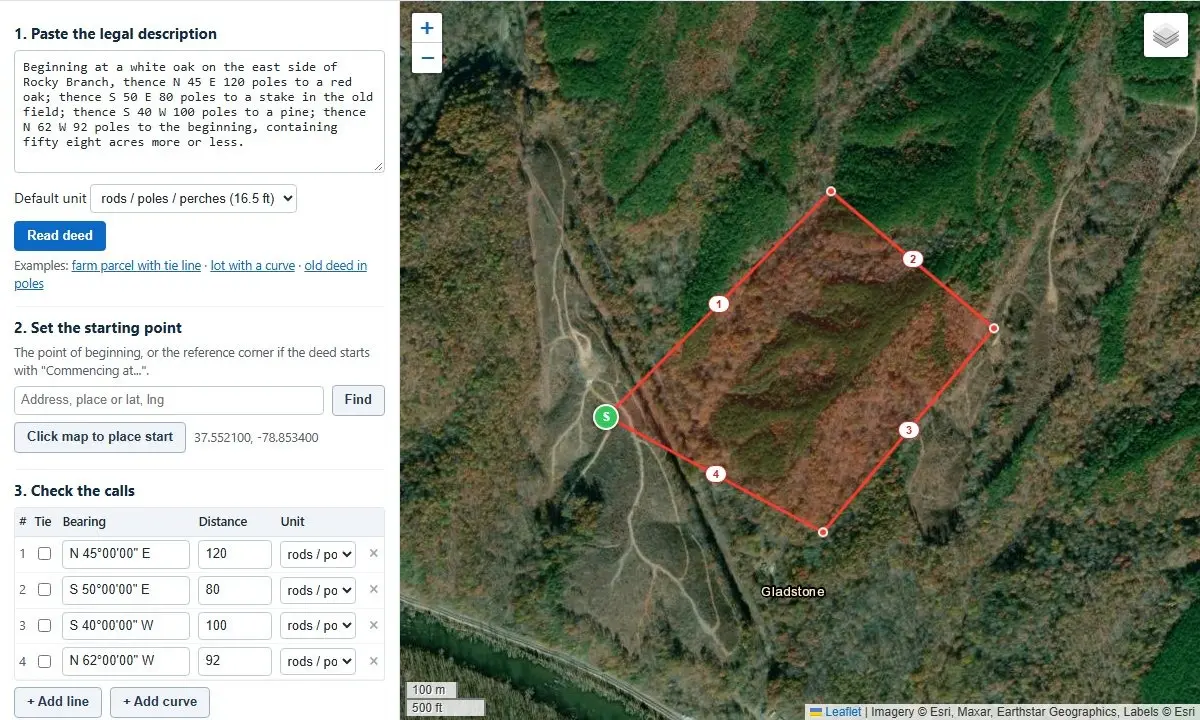
The complex legal jargon embedded within real estate property deeds has long posed a significant challenge for landowners, real estate professionals, legal experts, and historians alike. For centuries, property boundaries in legal deeds have been defined through descriptive text containing geometric bearings, linear distances, and physical landmarks. Translating these written descriptions into visual, accurate geographic maps traditionally required specialized knowledge in land surveying, geometry, and geographic information systems.
The emergence of web-based digital deed plotting tools has transformed this technical task into an automated, accessible workflow. By allowing users to simply copy and paste legal descriptions directly from property deeds, modern software tools can automatically extract text, process complex mathematical calls, and render exact boundary overlays directly onto high-resolution satellite imagery.
Beyond visual plotting, these automated solutions calculate total acreage, evaluate mathematical closure, diagnose potential transcription errors in historic or modern documents, and adjust for historical variations in magnetic north. Operable entirely within standard web browsers without requiring external server data uploads, digital deed plotters bridge the gap between historic land documentation and contemporary spatial analysis.
How Automated Parsing Translates Legal Text into Visual Boundaries
The process of translating a written deed into a mapped perimeter relies on parsing the specific geographic calls that define a boundary. Legal land descriptions are notoriously non-standardized, written across different eras using varying formats, capitalization rules, and stylistic conventions.
Digital deed plotters parse these unstructured text blocks by identifying key components within each call: the directional bearing (such as North 45 degrees East), the distance traversed, and any curved segment parameters or tie lines. Advanced plotting tools accommodate modern descriptions complete with complex curves, tangents, and tie lines, while effortlessly processing centuries-old deeds written in historical measurement units with numbers spelled out entirely in words.
To ensure accuracy, the tool reviews the input text for ambiguities or irregular syntax. When the software encounters non-standard phrasing, ambiguous calls, or text patterns it cannot definitively parse, it flags the questionable entry in a clear diagnostic note directly beneath the processing box. This feedback mechanism allows users to verify specific calls against original physical deeds, ensuring that typographical errors in the input text are corrected prior to spatial analysis.
Area Calculation, Mathematical Closure, and Identifying Boundary Errors
A foundational rule of property boundary design is that a metes-and-bounds legal description must form a continuous geometric loop, ending at the exact location where it began—a starting point designated in legal documentation as the Point of Beginning. The gap between the final corner point of a boundary description and its initial starting point is known in land surveying as the misclosure.
To quantify the mathematical accuracy of a deed, the plotter compares the total perimeter length of the property against the length of this misclosure gap. Expressed as a ratio—such as 1 : 10,000—this metric represents the mathematical precision of the survey. In modern land surveying, boundary descriptions typically achieve high precision ratios, frequently closing at or better than 1 : 10,000. Conversely, historical deeds compiled during the 18th and 19th centuries using basic compasses and physical measuring chains routinely exhibit lower precision ratios, often closing between 1 : 200 and 1 : 1,000. Within the context of historical land documentation, these lower ratios are considered normal standards of accuracy for their era.
When a legal description fails to close properly, the issue is frequently traced to a single isolated error made during manual transcription or original drafting. Typical errors include inverted cardinal directions—such as mistaking North for South or East for West—a missing call, or a mistyped numerical distance.
To resolve these discrepancies, modern deed plotters incorporate automated error-detection routines. The automated "Find the bad call" feature systematically evaluates each call in the description, recalculating the geometry to test potential corrections. It then generates a prioritized list of suggested edits that would mathematically close the boundary figure, presenting the most probable corrections at the top of the list.
Alongside closure analysis, digital deed plotters compute the precise area enclosed within the described boundaries. The software calculates total land area in multiple standard measurement units, displaying results simultaneously in acres, square feet, and hectares. When property descriptions include curved boundaries, the calculation accounts for the precise geometric area of arc segments, measuring the true spatial slice situated between the straight chord line and the curved outer perimeter.
Bridging Historical Surveys, Archaic Units, and Magnetic Drift
Plotting historical land deeds presents unique challenges due to obsolete units of measurement and shifting navigational baselines. Early American land grants and colonial property records relied heavily on early surveying instruments, primarily the magnetic compass and metal measuring chains.
These historical surveys expressed distances using traditional measuring systems that are rare in modern commerce:
- Poles, Perches, and Rods: Each of these interchangeable historical units equals exactly 16.5 feet.
- Chains and Links: A standard Gunter’s chain measures 66 feet in length and is subdivided into 100 individual links, with each link measuring 0.66 feet. Ten square chains equal exactly one acre.
- Texas Varas: A regional unit frequently encountered in historical Texas land records, standardized at 33 1/3 inches (approximately 2.78 feet).
In addition to archaic linear units, historical surveys were referenced to magnetic north rather than true geographic north. Earth’s magnetic field undergoes continuous spatial and temporal drift, causing the position of magnetic north to shift over decades and centuries. Consequently, a compass bearing recorded in a 17th- or 18th-century survey will not align with modern satellite maps without adjusting for magnetic declination—the angular difference between magnetic north and true north at a specific time and location.
Modern deed plotting tools address magnetic drift by offering numerical rotation controls. By entering the historical magnetic declination value corresponding to the year and geographic location of the original survey, users can correctly rotate the boundary shape to align with modern ground features on satellite imagery. Positive values are entered for eastern magnetic declination, while negative values represent western declination. Historical declination values can be obtained from authoritative scientific databases such as the National Oceanic and Atmospheric Administration (NOAA), making these tools invaluable for genealogists, historians, and legal researchers aiming to map ancestral land holdings onto contemporary landscapes.
Interoperability Across Modern GIS, CAD, and Mapping Platforms
While instant visualization on satellite imagery provides immediate spatial clarity, modern land analysis often requires integrating boundary data into broader digital mapping workflows. Digital deed plotters accommodate these multi-platform requirements by allowing users to export drawn boundaries into standard geospatial and engineering file formats.
Spatial data generated by the plotter can be exported directly for use in Computer-Aided Design (CAD) software, Geographic Information Systems (GIS), and global visualization software such as Google Earth. By supporting standard vector exports, professionals can import mapped property boundaries directly into civil engineering projects, municipal planning platforms, or custom environmental mapping layers without having to manually re-enter boundary calls.
Metes and Bounds Versus the Public Land Survey System
Understanding how a deed is plotted requires recognizing the underlying land survey system used to create the legal description. In North America, two dominant legal frameworks govern land description: the Metes and Bounds system and the Public Land Survey System (PLSS).
Metes and bounds is the older of the two systems, originating in historic English common law. It defines land boundaries by describing a continuous walking path around the property: starting at a specified landmark (the Point of Beginning), the description proceeds along a series of explicit bearings and distances before returning to the start. Metes and bounds remains the primary boundary system used across the original thirteen American colonies, Hawaii, Texas, and several early settled states.
In contrast, much of the remaining United States was surveyed under the Public Land Survey System (PLSS), established by the federal government to systematically survey and divide public lands. The PLSS organizes land into a standardized grid network composed of townships, ranges, and sections.
In modern real estate transactions, boundary descriptions frequently combine aspects of both systems. A legal deed may define a parcel using metes-and-bounds bearings and distances, but tie its initial Point of Beginning directly to a established PLSS section corner. To assist users in locating these macro-grid frameworks, complementary geospatial utilities—such as section, township, and range finders, PLSS coordinate converters, and single bearing-and-distance calculators—are routinely employed alongside automated deed plotters.
Boundary Checks Versus Professional Land Surveys
While automated deed plotting software provides powerful diagnostic and analytical capabilities, it is essential to distinguish between a visual deed plot and an official land survey.
A digital deed plot is a mathematical and visual representation of what is written within a text document. It models the geometric instructions contained on paper. In contrast, a legal land survey is a physical, legally binding determination of property boundaries conducted on the ground by a licensed professional land surveyor. Licensed surveyors locate actual physical markers, evaluate historical title records, resolve conflicting evidence, and apply legal doctrines to establish definitive boundary lines.
Digital deed plotters serve as educational, analytical, and preparatory tools. They enable property owners, legal counsel, and real estate professionals to visualize legal land text, detect potential transcription or calculation errors, and hold more informed discussions with professional land surveyors or legal representatives.
When a deed fails to close or displays unexpected shapes, the underlying cause is typically traced to manual typing errors, missing calls in historical record transcriptions, incomplete curve data, or the inherent precision limits of historical compass-and-chain techniques. By testing calls manually or utilizing automated error detection, users can isolate discrepancies and compare them directly against original historical deeds.
To protect sensitive land record data, modern browser-based deed plotters operate entirely client-side. All processing algorithms, text parsing, and geometric calculations run directly within the user’s local internet browser. Legal descriptions pasted into the tool are neither uploaded to external web servers nor stored in remote databases, ensuring complete privacy for proprietary, legal, or personal property information.