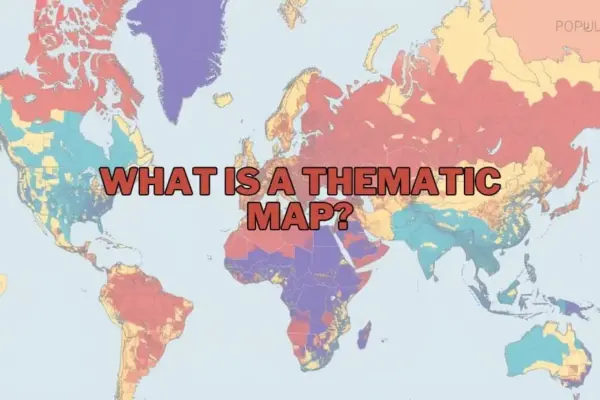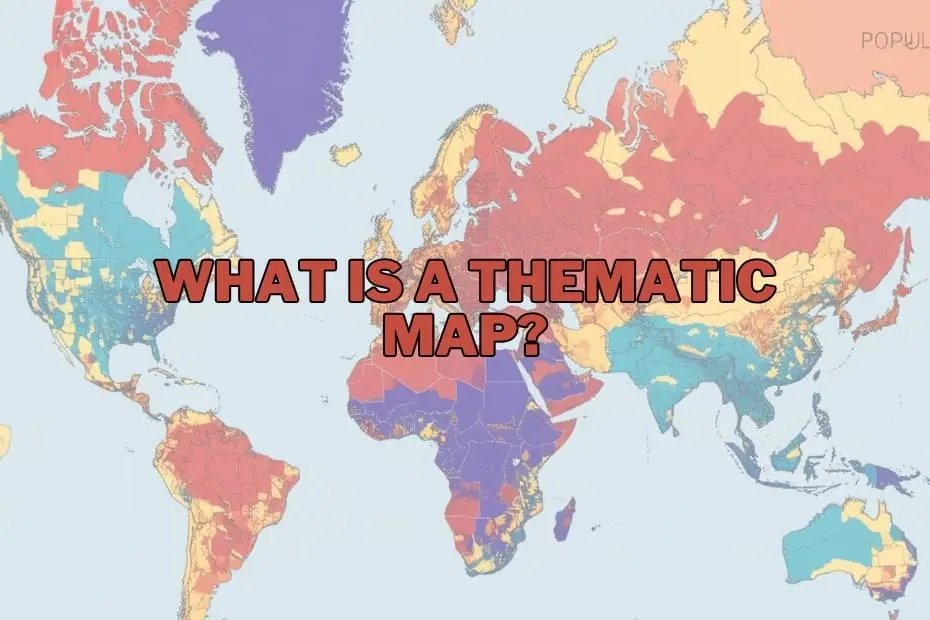
In an era defined by an unprecedented explosion of spatial data, maps have evolved far beyond their traditional function as simple instruments for navigation. While general reference maps guide travelers from point A to point B by depicting physical and built features such as highways, rivers, elevation contours, and municipal boundaries, thematic maps serve an entirely different purpose. They act as specialized analytical tools designed to tell compelling stories, uncover hidden spatial patterns, and render complex, abstract datasets into intuitive visual formats.
A thematic map focuses on a specific subject, theme, or statistical variable across a defined geographic area. Rather than prioritizing physical spatial navigation, these maps illustrate how specific attributes—ranging from population density and median household income to climate trends and regional economic output—are distributed geographically. By synthesizing statistical data with spatial location, thematic maps provide geographers, researchers, policy planners, and corporate decision-makers with the visual intelligence necessary to interpret complex societal, environmental, and economic phenomena.
As data visualization becomes an essential component of modern decision-making, understanding the mechanics, applications, visual design, and limitations of thematic maps is vital for anyone working with geographic information.
Purpose and Importance of Thematic Maps
The primary purpose of a thematic map is to communicate spatial data effectively and efficiently. Raw statistical tables and spreadsheets often obscure critical geographic relationships, making it difficult to discern how phenomena interact across regional boundaries. By contextualizing numbers within a spatial framework, thematic maps allow observers to immediately recognize trends, clusters, disparities, and anomalies that might otherwise remain buried in massive datasets.
The importance of these maps spans numerous critical sectors. In public health, for instance, thematic mapping enables epidemiologists to track disease outbreaks, identify vulnerable populations, and allocate medical resources where they are needed most. In urban planning and public policy formulation, thematic maps assist municipal authorities in evaluating population growth trends, planning public transit expansion, and optimizing public service delivery. Furthermore, as global environmental challenges accelerate, thematic maps offer vital insights into how shifting weather patterns affect agricultural productivity, forest cover, and coastal vulnerabilities. By transforming abstract raw statistics into actionable visual narratives, thematic maps bridge the gap between complex data analysis and real-world spatial understanding.
Types of Thematic Maps
To present different types of data accurately and compellingly, cartographers and spatial analysts utilize several distinct varieties of thematic maps. Each map type is uniquely suited to specific data structures, levels of measurement, and analytical objectives.
Choropleth Maps
Among the most widely recognized thematic map types, choropleth maps use varying shades of color, patterns, or symbol intensities to represent aggregated quantitative data within predefined administrative units, such as countries, states, counties, or census tracts. They are best suited for presenting normalized statistics, such as population density, literacy rates, per capita income, or percentage voting distributions.
Proportional and Graduated Symbol Maps
These maps utilize symbols—most commonly circles or squares—scaled in proportion to the statistical value of the variable being measured at specific locations. Unlike choropleth maps, which fill entire administrative regions with color, proportional symbol maps are particularly effective for displaying absolute quantities, such as total energy production per power plant, total population size in specific cities, or total sales volume by regional node.
Isoline and Isarithmic Maps
Isoline maps employ continuous lines to connect points of equal quantitative value across a geographic surface. Frequently utilized in meteorology, oceanography, and topography, these maps illustrate continuous spatial phenomena such as temperature gradients (isotherms), atmospheric pressure (isobars), precipitation levels (isohyets), or topographic elevation (contours).
Dot Density Maps
Utilizing individual dots or points to represent a specified quantity of a given feature, dot density maps showcase spatial distribution and density variations without being restricted by geographic boundary shading. Each dot on the map represents a set quantity—for example, one dot per 500 residents—allowing viewers to observe visual clusters, sparse regions, and spatial transitions in a natural visual manner.
Cartograms
Cartograms deliberately distort standard geographic size or geometry based on a chosen statistical variable rather than physical land area. For example, a global population cartogram resizes countries relative to their total population size rather than their actual square mileage, offering a striking visual reinterpretation of global spatial demographics.
Flow Maps
Designed to display spatial interaction and movement across geographic space, flow maps use lines of varying thickness, color, or directional arrows to illustrate the volume and direction of goods, people, information, migratory trends, or trade volumes traveling between origins and destinations.
Key Elements of a Thematic Map
Creating an effective and scientifically accurate thematic map requires systematic attention to cartographic design principles. A well-constructed thematic map relies on several essential visual and technical elements to ensure that the geographic story is conveyed clearly and without misinterpretation:
- Clear A concise title provides immediate analytical context, explicitly stating the subject, variable, geographic area, and timeframe of the underlying dataset.
- Comprehensive Legend: The map key or legend defines the precise meaning of all colors, shading gradations, symbols, line weights, and numeric breaks used on the map, enabling viewers to decode quantitative and qualitative spatial information effortlessly.
- Map Scale: Scale establishes geographic proportion, indicating the quantitative relationship between distances represented on the map visual and actual ground distances, typically presented as a bar scale or numeric ratio.
- Orientation Indicator: A standard north arrow or compass rose establishes spatial orientation, helping viewers maintain geographic awareness across the mapped domain.
- Data Source Attribution: Proper documentation of data origin ensures transparency, academic rigor, and analytical credibility, allowing users to verify the freshness and reliability of the underlying geographic data.
- Appropriate Color Palettes and Classification: Selecting suitable visual schemes—such as sequential colors for ordered quantitative data, divergent colors for datasets with meaningful midpoints, or categorical colors for qualitative groups—ensures that patterns reflect empirical reality without visual bias.
Applications of Thematic Maps
The utility of thematic mapping extends across virtually every modern industry and academic discipline that relies on spatial intelligence:
- Public Policy and Government: Municipalities and national government agencies utilize thematic maps to analyze demographic shifts, assess socioeconomic inequality, assign electoral boundary lines, and prioritize infrastructure investments.
- Public Health and Epidemiology: Health organizations track disease transmission patterns, monitor healthcare access disparities, and model community health vulnerabilities during public health emergency events.
- Environmental Science and Conservation: Climate scientists and conservationists map land cover dynamics, forest loss rates, biodiversity distributions, and regional climate risks to formulate targeted environmental conservation strategies.
- Business, Commerce, and Real Estate: Commercial enterprises rely heavily on location intelligence to evaluate consumer demographics, identify high-performing retail locations, optimize supply chain networks, and conduct site selection analysis.
- Emergency Management and Crisis Response: Disaster response agencies use thematic maps to assess natural hazard risks, map vulnerable infrastructure, coordinate emergency evacuation routes, and deploy relief supplies following severe weather events.
Advantages of Thematic Maps
Thematic maps offer major advantages over standard data tables and basic navigation maps. Their primary benefit lies in their capacity for rapid visual communication; complex spatial patterns, clusters, and regional trends that might require extensive statistical modeling to extract from a raw database can be comprehended almost instantly on a map.
Furthermore, thematic maps enable analysts to detect spatial autocorrelation, regional disparities, and geographical outliers that provide deep analytical insight. By simplifying complex data structures into visually engaging graphic formats, thematic maps democratize access to data, making technical geographic research intelligible to policy stakeholders, executive leaders, and the general public.
Limitations of Thematic Maps
Despite their analytical power, thematic maps carry inherent technical limitations that cartographers and data consumers must carefully navigate. A major challenge involves the potential for visual distortion caused by spatial data aggregation. In choropleth mapping, for example, physically large administrative territories can visually dominate the map frame, giving disproportionate visual weight to sparsely populated rural zones over small, densely populated urban environments.
Additionally, the choice of data classification methodology—such as dividing quantitative data into natural breaks, equal intervals, or quantiles—can fundamentally alter the visual appearance of a map and lead to conflicting conclusions from the exact same underlying dataset. Map designers must also remain cognizant of the Modifiable Areal Unit Problem (MAUP), where altering the scale of spatial aggregation units (for instance, examining data at the county level versus the zip code level) changes the visible spatial relationships. Understanding these potential pitfalls is critical for ensuring responsible cartographic design and accurate interpretation.
Tools and Software for Creating Thematic Maps
Advancements in digital geographic technologies have made thematic map creation widely accessible to researchers, data analysts, and cartographers. Geographic Information Systems (GIS) and modern visual analytics platforms provide robust environments for generating customized thematic visualizations:
- QGIS: A powerful, open-source desktop GIS platform widely used across academia, public sectors, and research institutions due to its comprehensive spatial analytical features, rich plugin ecosystem, and accessible cost model.
- ArcGIS: The commercial industry-standard GIS platform developed by Esri, providing advanced geospatial analysis, dynamic spatial modeling, high-end cartographic layout engines, and enterprise cloud capabilities.
- Tableau: A widely adopted business intelligence software platform that incorporates integrated geospatial mapping functionalities, allowing corporate analysts to seamlessly build interactive thematic maps within broader executive dashboards.
- Mapbox and Web Mapping Frameworks: Developer-focused mapping platforms and open-source JavaScript libraries that enable custom spatial data styling, interactive visual storytelling, and seamless integration into dynamic web and mobile applications.
Conclusion
Thematic maps represent a crucial intersection between statistical data, geographic analysis, and dynamic visual communication. Far more than passive visual aids, they serve as indispensable analytical tools for discovering spatial insights, guiding public policy, advancing scientific inquiry, and driving business strategy. As spatial data continues to proliferate through modern mobile devices, satellite imagery, and dynamic sensor networks, the ability to build and interpret effective thematic maps will remain a vital skill in the data-driven world.
FAQs: What is a Thematic Map?
What is the difference between a thematic map and a reference map?
Thematic maps focus on visualizing the spatial distribution of a specific theme, attribute, or statistical variable, such as population density or climate data. In contrast, reference maps show general geographic and physical features, such as roads, rivers, political borders, and landforms, primarily designed for spatial navigation and location identification.
Can thematic maps be used for historical data?
Yes, thematic maps are exceptional tools for visualizing historical trends and temporal changes over time. By mapping historical datasets across sequential timeframes, analysts can visually track shifts in urban development, population migrations, historic disease outbreaks, or shifting political boundaries.
What software is best for beginners to create thematic maps?
For beginners looking to build thematic maps, QGIS and Tableau offer user-friendly entry points. QGIS provides a free, open-source GIS environment with rich cartographic tools, while Tableau enables straightforward drag-and-drop geographic mapping for users already working with business spreadsheets and databases.
How do I choose the right type of thematic map for my data?
Selecting the appropriate thematic map depends on the characteristics of your dataset. Continuous physical phenomena like temperature or elevation are best mapped using isoline maps. Categorical or aggregated numerical data linked to administrative zones suit choropleth maps, while discrete point datasets and absolute counts are often best displayed using dot density or proportional symbol maps.
Are thematic maps only used in geography?
No, thematic maps are utilized across a vast array of disciplines beyond academic geography. They are extensively applied in fields such as business intelligence, public health, urban planning, environmental resource management, political science, economic research, and emergency management.