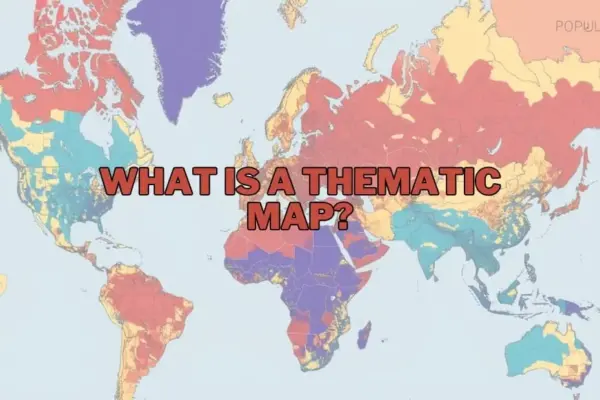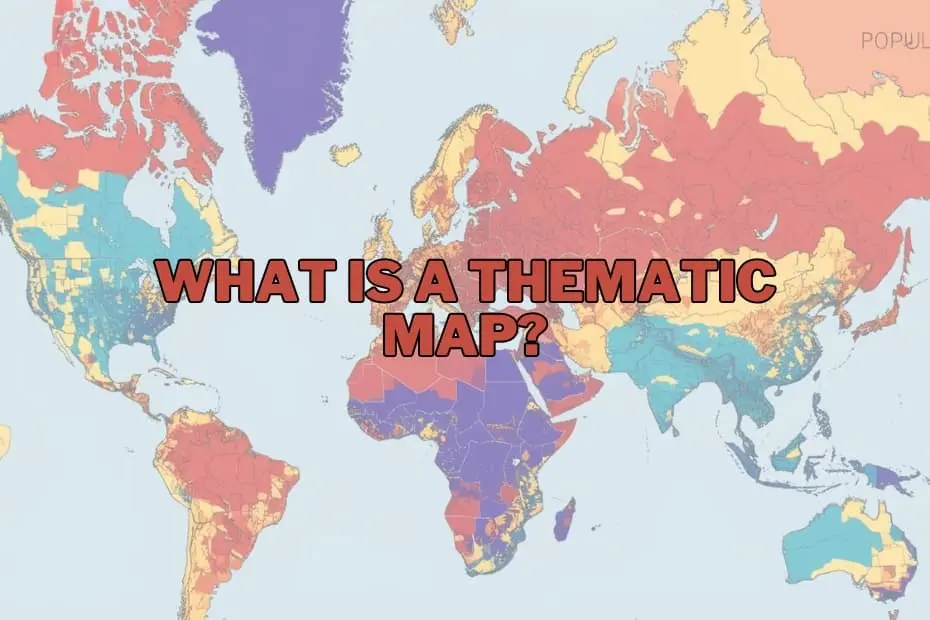
In an era defined by an unprecedented deluge of spatial information, modern cartography serves a purpose that extends far beyond fundamental physical navigation. While traditional reference maps remain essential for locating roads, municipal borders, and physical landforms, thematic maps have established themselves as an indispensable instrument for visualizing data, unlocking spatial patterns, and driving strategic decision-making. By translating raw numerical and categorical information into clear visual representations, thematic cartography provides researchers, policymakers, and industry analysts with the means to make sense of complex geographic phenomena.
Unlike standard geographic layouts, thematic maps prioritize specific subjects or datasets across designated geographic areas. Whether illustrating regional variations in population density, mapping shifting climate zones, or highlighting localized economic activity, these visual instruments convert abstract metrics into intuitive geographic stories. As the demand for data-driven insights grows across diverse sectors, understanding the design, functionality, and analytical power of thematic mapping has become increasingly vital.
Defining the Thematic Map: Focus Beyond Topography
A thematic map is a specialized visual representation designed to emphasize spatial distributions and relationships pertaining to a particular topic or subject. While general reference maps emphasize topographic features—such as highways, rivers, cities, and elevations—to help users determine location, thematic maps relegate these structural features to a secondary role. Instead, they leverage visual variables such as color gradients, varied symbology, and targeted shading to display specific analytical variables.
The core strength of a thematic map lies in its focused perspective. By isolating a single variable or a set of closely related attributes—such as annual rainfall distribution across a watershed or localized unemployment rates across metropolitan areas—the map abstracts away unnecessary geographic detail. This targeted visualization allows viewers to identify spatial trends, clusters, and anomalies that would otherwise remain hidden in spreadsheet records or tabular databases.
Purpose and Importance in Spatial Analysis
The fundamental purpose of thematic mapping is the effective communication of spatial data. Humans are inherently visual processors, and interpreting numerical data organized by geographical coordinates can be remarkably challenging without visual aid. Thematic maps bridge this gap by mapping qualitative and quantitative metrics directly onto spatial frameworks, illuminating relationships that guide critical operational decisions.
In public policy and urban planning, for instance, thematic maps clarify how demographic shifts influence infrastructure demands, housing requirements, and public transit routing. In environmental science, these visual tools demonstrate how climate change affects agricultural yield, ecological habitats, and water resource availability over time. By simplifying multi-layered spatial datasets into unified visual insights, thematic maps enable stakeholders across government, academia, and private enterprise to evaluate risks, allocate resources efficiently, and formulate evidence-based strategies.
Types of Thematic Maps and Their Analytical Roles
Different analytical challenges require distinct cartographic techniques. Thematic mapping encompasses several specialized styles, each tailored to specific data structures and display goals:
- Choropleth Maps: Among the most widely utilized cartographic forms, choropleth maps apply varying color tones or shading intensities to predefined geographic areas, such as countries, states, or census tracts. They are uniquely effective for displaying aggregated statistical data, such as per capita income or population density, allowing immediate comparisons between neighboring regions.
- Isoline (Isarithmic) Maps: Isoline maps connect points of equal value using continuous lines, creating visual surfaces for continuous geographic phenomena. Most commonly seen in meteorology and hydrology, these maps effectively represent smooth gradients such as temperature distribution, elevation variations, and atmospheric pressure.
- Proportional and Graduated Symbol Maps: These maps utilize shapes—such as circles or squares—scaled proportionately to the magnitude of the metric being measured at specific point locations. They are ideal for depicting discrete quantitative variables, such as total industrial output per factory or total traffic volume at major intersections.
- Dot Density Maps: By placing dots of uniform size within a region—where each dot represents a fixed quantity of a variable—dot density maps visualize geographic concentration and spatial dispersion without the rigid boundaries imposed by choropleths.
- Cartograms: Cartograms distort physical geography intentionally, scaling spatial units according to the data variable being represented—such as national population or gross domestic product—rather than actual land area. This dramatic visual transformation challenges conventional geographic perceptions to highlight global or regional disparities.
Key Elements of Effective Cartographic Design
Creating a impactful thematic map requires careful balance between aesthetic clarity and scientific accuracy. Cartographers rely on several core design elements to ensure that mapped information is interpreted correctly:
- Title and Sub A clear, concise title establishes the map’s central subject, geographic scope, and time frame, providing crucial context before the user interprets the spatial patterns.
- Legend (Map Key): The legend serves as the primary visual decoder, defining what specific colors, line weights, or symbol sizes signify in terms of numerical values or qualitative categories.
- Map Scale: Scale indicators establish the quantitative relationship between distances on the map and actual distances on the ground, ensuring spatial proportion is maintained.
- Data Source and Documentation: Citing authoritative data sources guarantees transparency, allowing readers to evaluate the credibility, collection date, and reliability of the underlying dataset.
- Color Schemes and Visual Hierarchy: Selecting appropriate color ramps—such as sequential scales for continuous data or diverging scales to highlight deviations from a baseline—ensures that visual emphasis matches data significance without misleading the audience.
Applications Across Diverse Fields
The versatility of thematic cartography makes it an essential tool across a vast spectrum of professional discipline:
- Public Health and Epidemiology: Health officials utilize thematic mapping to track disease outbreaks, analyze health resource distribution, and evaluate environmental health hazards across communities.
- Environmental Science and Resource Management: Resource managers deploy isoline and choropleth maps to monitor deforestation, track climate-induced drought patterns, and map conservation zones.
- Business Analytics and Market Research: Commercial enterprises rely on spatial data mapping to assess consumer demographics, evaluate candidate locations for retail expansion, and optimize supply chain networks.
- Government Administration and Urban Planning: Municipalities leverage thematic mapping for tax assessment visualisations, zoning adjustments, emergency response planning, and public utility management.
- Historical and Longitudinal Research: Historians and sociologists utilize thematic techniques to map historical trade routes, demographic migrations, and economic shifts over extended temporal horizons.
Strategic Advantages and Known Limitations
While thematic maps offer immense analytical value, cartographers and decision-makers must weigh their distinct strengths against inherent visual and structural limitations.
Advantages
The primary advantage of a thematic map is its visual efficiency. Complex tabular datasets comprising thousands of records can be rendered instantly intelligible in a single map layout. By transforming abstract numbers into spatial patterns, thematic maps facilitate rapid trend recognition, streamline comparative analysis, and serve as compelling communication tools when presenting findings to non-technical stakeholders.
Limitations
Conversely, thematic maps carry risks of visual misrepresentation if designed improperly. A primary challenge involves spatial aggregation bias, where boundary choices artificially distort data perception. Furthermore, inappropriate classification schemes, poor color contrast choices, or outdated source data can inadvertently mislead viewers or obscure critical local variations. Cartographers must remain vigilant against oversimplification, ensuring that design choices preserve statistical integrity.
Modern Tools and Software Ecosystem
The process of constructing thematic maps has evolved significantly, shifting from traditional manual drafting to sophisticated digital computing platforms. Today, accessible software solutions allow experts and beginners alike to turn geographic datasets into publication-ready visual displays:
- Geographic Information Systems (GIS): Industry-standard software packages like QGIS (an open-source platform) and ArcGIS provide robust, professional environments for advanced spatial analysis, vector manipulation, and dynamic thematic mapping.
- Business Intelligence and Visualization Platforms: Data visualization tools such as Tableau, Power BI, and specialized web-mapping libraries enable analysts to integrate spatial features directly into interactive corporate dashboards.
- Web Mapping Tools: Lightweight online mapping services and web applications offer streamlined, user-friendly interfaces for quickly rendering basic choropleth and dot-density visualizations without requiring complex GIS software installation.
Frequently Asked Questions
What is the fundamental difference between a thematic map and a reference map?
A reference map focuses on displaying physical location features, such as roads, rivers, political boundaries, and topographic features, primarily aiding navigation. A thematic map focuses on visualizing spatial distribution trends related to a specific topic, such as climate, income, or population density.
Can thematic maps effectively represent historical data?
Yes. Thematic maps are widely used to depict historical patterns, such as past population movements, temporal shifts in industrial output, or changing political boundaries over consecutive historical periods.
Which tools are recommended for beginners entering spatial mapping?
For individuals beginning cartographic visualization, open-source platforms like QGIS provide comprehensive tools without software licensing costs. Additionally, business intelligence applications like Tableau offer intuitive drag-and-drop interfaces for simple spatial dataset integration.
How does one select the appropriate thematic map type for a dataset?
The choice depends on data structure. Continuous numerical phenomena across open space (such as temperature or rainfall) are best mapped using isoline maps. Aggregated regional statistics (such as county-level census metrics) align best with choropleth maps, while point-specific counts suit proportional symbol or dot density approaches.
Is thematic mapping utilized outside traditional geography?
Yes. Thematic mapping is extensively employed across private enterprise, public health management, environmental engineering, agricultural policy, market research, and urban planning.