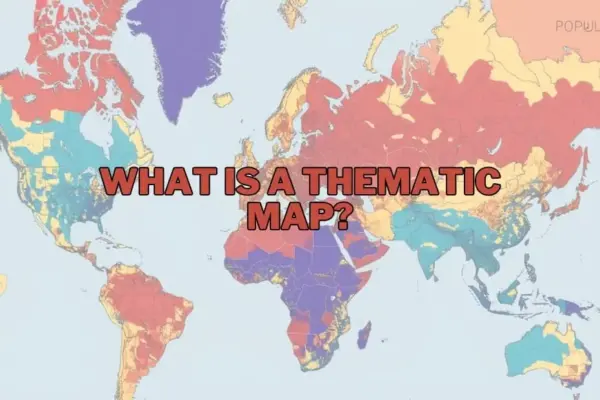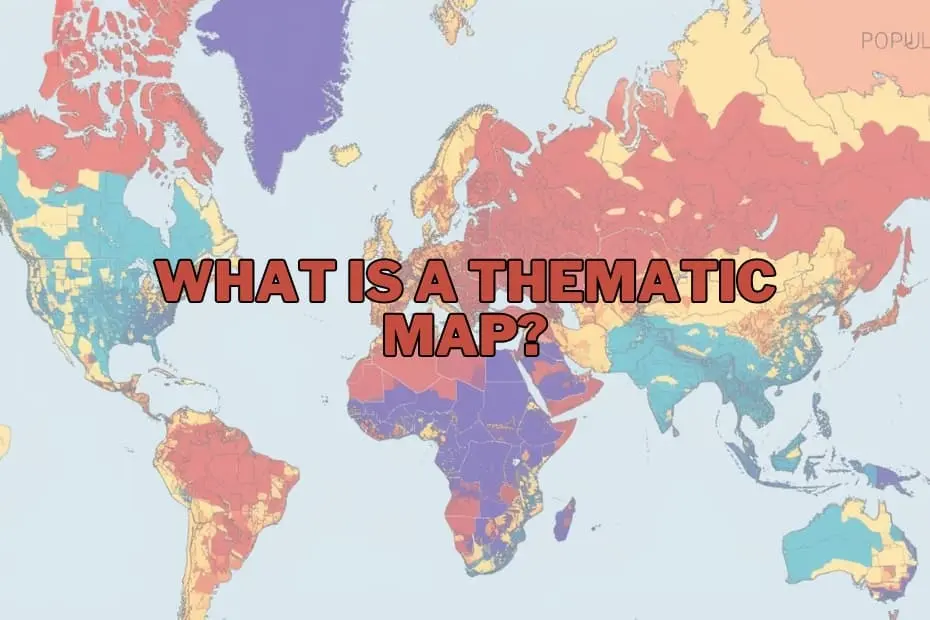
In the evolving disciplines of geography, spatial analysis, and data visualization, maps have expanded far beyond their traditional roles as basic instruments for navigation. Modern cartography serves as a sophisticated medium for visual storytelling, allowing researchers, urban planners, and policy analysts to unearth concealed patterns and convey complex geospatial information. While traditional reference maps focus on physical geography and navigation—such as highlighting roads, topography, and administrative boundaries—thematic maps are designed specifically to illustrate spatial distributions related to specialized subjects.
As reliance on spatial intelligence grows across public policy, corporate strategy, and scientific research, understanding thematic mapping has become increasingly vital. By rendering raw statistical numbers into intuitive visual distributions using distinct colors, scaled symbols, and customized shading, thematic maps offer a clear window into regional variations, environmental patterns, and demographic shifts across local and global landscapes.
Purpose and Importance of Thematic Maps
The core purpose of a thematic map is to communicate spatial distribution and complex data patterns in an accessible visual format. Rather than presenting static lists of raw figures or extensive statistical tables, thematic mapping translates demographic, environmental, and socio-economic datasets into structured spatial displays. This transformation allows viewers to immediately recognize geographical variations, local anomalies, and macro-level trends that might otherwise remain buried in conventional spreadsheet formats.
The importance of these maps spans numerous professional domains. In public administration and urban design, thematic maps clarify how demographic shifts and population growth influence local infrastructure requirements, housing demands, and public services. In environmental management, these visualization tools illustrate the real-world consequences of climate change, mapping shifted agricultural yields, variations in precipitation, and localized temperature anomalies. By bridging the gap between raw quantitative metrics and geographical realities, thematic maps equip analysts, business strategists, and decision-makers with actionable intelligence grounded in spatial context.
Types of Thematic Maps
Cartographers and data analysts employ several distinct categories of thematic maps, selecting specific map structures based on the nature of the data collected and the narrative intended for presentation:
- Choropleth Maps: Among the most widely used thematic visualizers, choropleth maps apply varying shades, colors, or visual patterns to predefined administrative areas—such as countries, states, or zip codes. Each shade corresponds to a specific numerical statistical range, making choropleth maps particularly effective for displaying discrete categorical data or density metrics, such as median income levels or regional population density.
- Isoline (Isopleth) Maps: Designed primarily for continuous geographic phenomena, isoline maps utilize continuous lines to connect points of equal value across a terrain. Commonly seen in meteorological reports and topographical studies, isoline maps effectively depict smoothly changing environmental variables such as atmospheric pressure, elevation, and regional rainfall trends.
- Proportional and Graduated Symbol Maps: These maps utilize visual symbols—most frequently circles, squares, or custom icons—placed at specific point locations. The visual dimensions of the symbol scale proportionally to match the magnitude of the dataset being measured. This approach allows analysts to showcase variable quantities, such as localized industrial emissions or municipal population counts, without altering underlying administrative boundaries.
- Dot Density Maps: By utilizing individual dots or uniform symbols to represent a precise quantitative value of a chosen attribute, dot density maps offer an intuitive visualization of spatial concentration and dispersion. Regions featuring a high density of dots visually signal heavy concentrations, making this format ideal for displaying urban population distributions and localized disease tracking.
- Cartograms: A cartogram deliberately distorts geographic geography, scaling territorial boundaries not by physical land mass, but according to a specific statistical variable—such as total economic output or national population size. This intentional distortion eliminates spatial footprint bias and places immediate visual emphasis on statistical dominance.
Key Elements of a Thematic Map
Creating a clear and cartographically sound thematic map requires the integration of several fundamental structural elements:
- Title and Sub A clear, concise title establishes the core subject, geographic scope, and relevant time period of the map, giving viewers immediate context regarding the displayed phenomena.
- Map Legend or Key: The legend serves as the primary translation guide for the visual map, explaining the exact numerical ranges, measurement units, color gradients, and geometric symbols used across the graphic layout.
- Scale and Orientation: Including a visual scale bar and orientation indicator (such as a north arrow) maintains geographic accuracy, allowing readers to gauge physical distances and spatial directions correctly.
- Data Source and Attribution: Citing the origin of the raw dataset ensures transparency, verifies academic rigor, and establishes the credibility of the presented information.
- Cartographic Classification and Symbolization: Careful selection of color palettes, continuous gradients, and visual symbols ensures that the data is represented accurately without introducing visual bias or confusing viewers.
Applications of Thematic Maps Across Fields
The application of thematic maps extends well across academic, civic, and commercial domains, illustrating their versatile utility in resolving complex spatial challenges:
- Public Health and Epidemiology: Health officials rely heavily on spatial mapping to track disease outbreaks, identify vulnerable populations, assess environmental health risks, and strategically optimize the geographical distribution of emergency healthcare resources.
- Environmental Science and Climate Analysis: Climatologists and ecologists utilize thematic visualizers to evaluate long-term shifts in weather patterns, map localized deforestation, monitor sea-level changes, and track agricultural productivity under shifting climate conditions.
- Urban Planning and Infrastructure: Municipal authorities employ spatial mapping to evaluate population movement, address localized traffic congestion, optimize public transit routes, and design equitable zoning policies.
- Economics and Business Market Research: Commercial analysts use thematic mapping to identify consumer demographics, evaluate market penetration, determine geographic expansion zones, and assess local economic factors such as regional unemployment rates.
- Historical and Longitudinal Studies: Historians and sociologists use thematic visualizations to track historical changes over extended periods, mapping historical migration waves, shifting political boundaries, and long-term socio-economic developments.
Advantages of Thematic Maps
The primary strength of thematic mapping lies in its capacity to simplify intricate datasets into intuitive visual representations. By converting complex numerical matrices into clear spatial displays, thematic maps facilitate rapid comprehension, enabling technical experts and non-specialist audiences alike to recognize spatial trends, clustering patterns, and geographic outliers instantly.
Furthermore, thematic maps serve as powerful communication instruments that enhance decision-making processes. Whether helping public administrators allocate emergency services or assisting corporate planners in choosing real estate locations, thematic maps present geographic intelligence in a persuasive, easy-to-digest visual format that highlights actionable spatial relationships.
Limitations of Thematic Maps
Despite their visual clarity and utility, thematic maps carry inherent limitations that cartographers must address carefully. A major risk involves data misinterpretation or spatial bias, particularly in choropleth maps where vast, sparsely populated geographic regions receive visually dominant shading that can obscure smaller, highly populated urban centers.
Additionally, thematic maps rely heavily on data aggregation across arbitrary administrative boundaries. This spatial grouping can mask micro-level variations and local nuances within a mapped area. The accuracy of any thematic map remains strictly constrained by the precision and quality of its underlying dataset; flawed or outdated statistical inputs inevitably yield misleading spatial visualizations.
Tools and Software for Creating Thematic Maps
Advancements in digital mapping software have made creating thematic visualizations significantly more accessible to researchers, spatial analysts, and beginner mappers. Modern Geographic Information System (GIS) platforms offer extensive toolsets tailored for geographic
data management and visual customizability.
Leading desktop software options, such as the open-source QGIS platform and professional GIS suites, provide robust spatial analysis tools capable of handling complex vector datasets and advanced cartographic design. Simultaneously, modern business intelligence and data visualization platforms like Tableau allow users to generate clean thematic maps directly from corporate spreadsheets without requiring extensive training in specialized cartography. These technologies enable analysts across diverse fields to transform raw quantitative records into meaningful, spatial visual narratives.
Frequently Asked Questions
What is the primary difference between a thematic map and a reference map?
A reference map focuses on displaying general geographic features, such as physical landscapes, coastlines, roads, and administrative boundaries, primarily aiding navigation. In contrast, a thematic map focuses on visual representation of a specific statistical topic or spatial dataset across a geographic region, such as climate variations, demographic density, or economic output.
Can thematic maps be utilized for analyzing historical data?
Yes. Thematic maps are highly effective for mapping historical metrics and longitudinal trends, enabling researchers to visually track changing spatial phenomena—such as historic migration patterns, territorial changes, or population growth—over designated historical epochs.
What mapping software is recommended for beginners learning thematic cartography?
For beginners entering cartography and spatial analysis, open-source GIS software like QGIS provides a comprehensive, cost-effective platform for learning. Additionally, data visualization platforms such as Tableau offer intuitive user interfaces suitable for quickly building foundational thematic visualizations.
How should an analyst determine the correct type of thematic map for a dataset?
Selecting the proper thematic map style depends largely on the structure and scale of the underlying data. Continuous variables across a geographic surface, such as temperature or elevation, are best represented through isoline maps. Discrete statistical data aggregated by administrative boundaries, such as regional income levels or population density, aligns cleanly with choropleth maps.
Are thematic maps used exclusively within the discipline of geography?
No. While rooted in cartographic principles, thematic maps are widely used across diverse fields, including public health, corporate market analysis, environmental science, journalism, economics, and public administration.