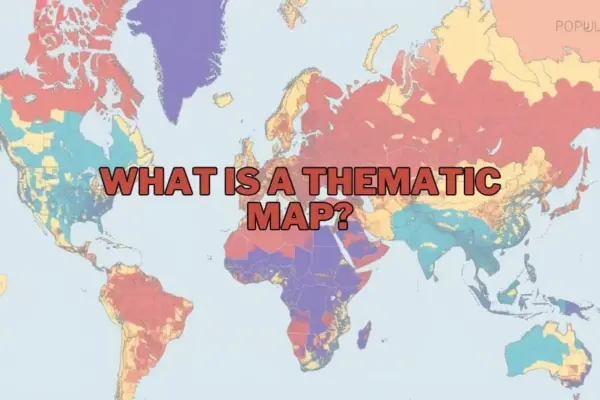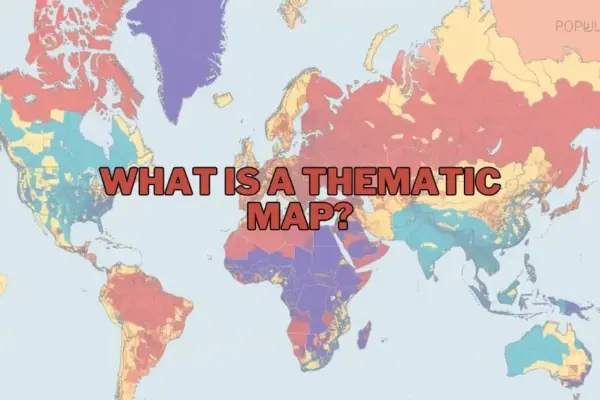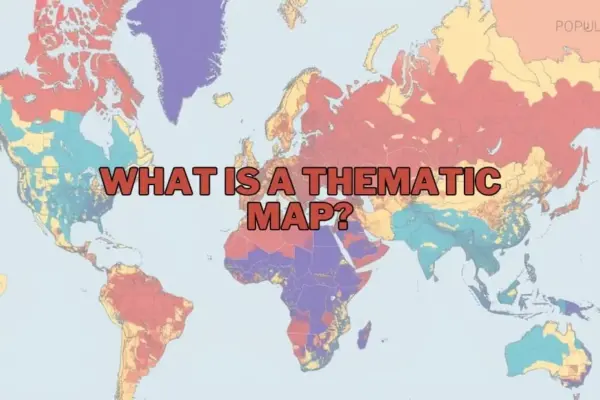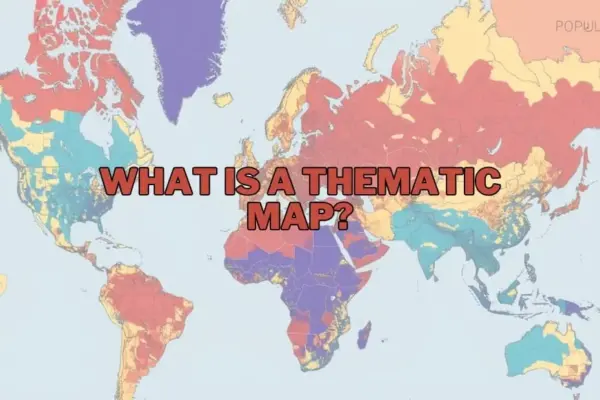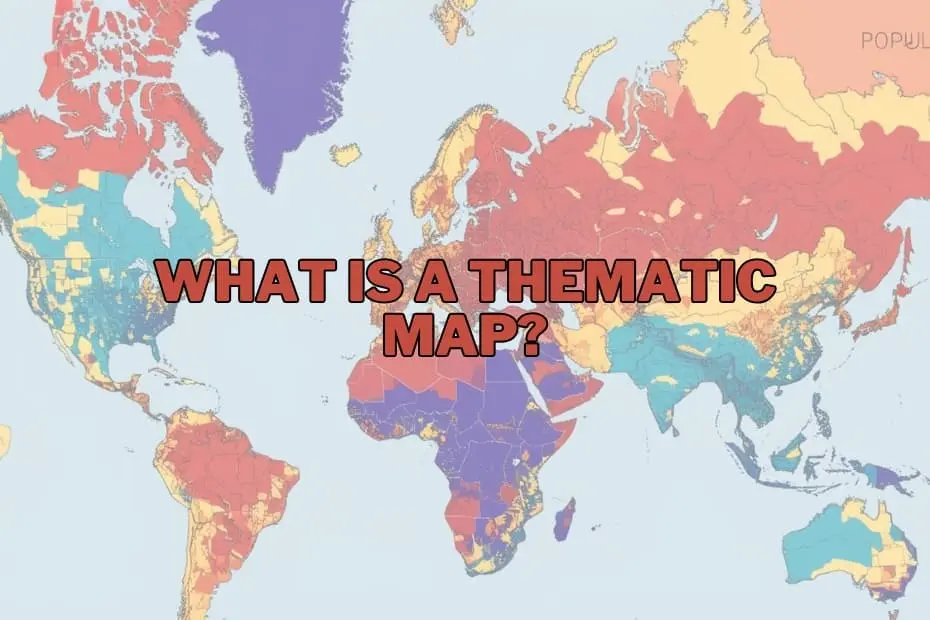
In an era increasingly defined by complex datasets and information overload, geographic maps have evolved far beyond basic tools for navigation. Modern cartography serves as a critical mechanism for narrative storytelling, spatial analysis, and strategic decision-making. Among the diverse array of mapping techniques available to geographers and data analysts, thematic maps stand out as one of the most effective mediums for transforming abstract spatial data into actionable visual insight.
Unlike traditional general reference maps, which prioritize physical and political features such as roads, rivers, coastlines, and municipal boundaries, thematic maps concentrate on a single subject or data theme. By illustrating the spatial distribution and variation of specific phenomena—ranging from regional population density and global climate trends to localized economic activity—thematic maps enable researchers, policy leaders, and the public to discern patterns that would otherwise remain hidden within spreadsheets and raw database records.
Defining the Purpose and Importance of Thematic Maps
At its core, the primary purpose of a thematic map is to communicate spatial data clearly and efficiently. Rather than serving as an all-purpose geographic guide, a thematic map answers focused questions about location, intensity, and structural relationships across space. By applying systematic visual variables such as color gradients, geometric symbols, and line densities, these maps illuminate geographic distributions that might take hours or days to decipher from textual data alone.
The significance of thematic cartography extends across nearly every sector of public and private life. Environmental scientists utilize thematic visualizations to track shifting weather conditions, analyze deforestation patterns, and model the long-term impacts of climate change on regional agricultural output. Urban planners rely on them to evaluate demographic shifts, identify housing deficits, and optimize public transportation infrastructure. Similarly, public health officials employ thematic mapping to monitor the spread of infectious diseases, allocate medical resources, and pinpoint localized health disparities.
By simplifying intricate datasets into intuitive visual representations, thematic maps democratize information. They bridge the gap between technical data collection and high-level decision-making, allowing stakeholders to grasp critical spatial relationships quickly and respond with evidence-based strategies.
Key Categories and Types of Thematic Maps
Cartographers employ several distinct mapping methodologies depending on the visual narrative required and the statistical structure of the underlying data. Understanding the strengths and suited applications of each map type is fundamental to effective geographic visualization.
Choropleth Maps
Choropleth maps are among the most frequently used thematic map types. They represent quantitative data aggregated within predefined administrative or geographic boundaries, such as countries, states, counties, or census tracts. Areas are shaded or colored in proportion to the statistical variable being measured, such as median household income or literacy rates. Choropleth maps are ideal for visualizing standardized data—such as percentages, rates, or densities—across distinct geographic regions.
Isoline (Isopleth) Maps
Isoline maps utilize continuous lines to connect geographic points that share equal numerical values. These lines, known as isolines or contours, create a seamless visual depiction of spatial continua. Common examples include topgraphic contour lines showing elevation, isotherms representing uniform temperature zones, and isohyets illustrating equal levels of precipitation. Isoline mapping is particularly crucial in meteorology, oceanography, and physical geography, where phenomena vary continuously across space without respecting human-defined boundaries.
Proportional and Graduated Symbol Maps
Proportional symbol maps display point data by scaling geometric shapes—most commonly circles—in direct proportion to the magnitude of the data at specific locations. For example, a proportional symbol map might use varying circle sizes to represent total population counts in major metropolitan areas, or traffic volumes at key highway intersections. Unlike choropleth maps, proportional symbol maps preserve absolute data values without requiring administrative aggregation, avoiding the visual distortion caused by large geographical land areas.
Dot Density Maps
Dot density maps display spatial distribution and frequency by placing uniform point symbols across a defined area, with each dot representing a specific quantity of a given feature. A single dot might represent 1,000 residents, ten cases of a disease, or fifty acres of farmland. The overall visual density of the dots reveals spatial clustering, concentration, and dispersion, offering a visually intuitive sense of regional variations without forcing data into strict artificial boundaries.
Cartograms
Cartograms intentionally distort the geographical shape and land area of regions to reflect a quantitative attribute rather than physical size. In a population cartogram, for instance, highly populated nations expand visually while geographically large but sparsely populated regions shrink. By distorting physical geography to emphasize statistical significance, cartograms disrupt traditional geographic visual biases and draw immediate attention to structural global disparities.
Essential Elements of Cartographic Design
To effectively communicate its intended message without misinforming the audience, a thematic map must incorporate several core design elements. These standardized cartographic components provide vital context, enable accurate interpretation, and establish scientific transparency.
- Map A concise, definitive title clearly establishes the theme, geographic scope, and time frame of the presented dataset, ensuring the viewer immediately grasps the subject matter.
- Legend or Key: The legend serves as the visual translator of the map. It explicitly defines the meaning of all colors, shading patterns, symbol sizes, and line weights used throughout the visualization.
- Scale Indicator: Whether expressed as a numeric ratio, a verbal statement, or a graphic scale bar, the scale provides essential spatial context regarding distance and size relationships across the mapped area.
- Orientation: A compass rose or north arrow establishes standard geographic orientation, aiding spatial awareness and contextual positioning.
- Data Source and Attribution: Citing the origin of the underlying dataset establishes credibility, allows for verification, and maintains rigorous standards of academic and journalistic integrity.
Broad Applications Across Research and Industry
The versatility of thematic mapping makes it an indispensable tool across a vast range of professional domains and academic disciplines.
Public Health and Epidemiology
From John Snow’s historical mapping of the 1854 London cholera outbreak to contemporary real-time tracking of global viral transmissions, spatial visualization remains a cornerstone of epidemiological analysis. Thematic maps help researchers track disease vectors, identify environmental risk factors, and coordinate targeted medical interventions.
Urban Planning and Infrastructure Development
Civil engineers, urban designers, and municipal authorities utilize thematic maps to analyze traffic flows, assess zoning compliance, manage public utilities, and evaluate land use efficiency. Visualizing demographic growth alongside existing service networks ensures infrastructure investments are directed where they are most needed.
Environmental Conservation and Resource Management
Resource managers and environmental scientists use thematic mapping to monitor deforestation rates, chart wildlife habitat fragmentation, track atmospheric pollutant concentrations, and manage water security. These tools are crucial for establishing conservation priorities and measuring the efficacy of environmental policy over time.
Business Analytics, Real Estate, and Commerce
In the private sector, thematic mapping drives site selection, market research, and logistics management. Businesses overlay customer demographic data, purchasing power metrics, and competitor locations onto choropleth or heat maps to identify unserved market niches and optimize supply chain routes.
Evaluating the Advantages and Inherent Limitations
While thematic maps are exceptionally powerful diagnostic and communicative tools, their utility depends heavily on proper design, accurate data, and ethical cartographic practices.
Key Advantages
The primary strength of thematic maps lies in their ability to summarize massive, complex spatial datasets into immediate visual patterns. They reveal geographic equity issues, point out regional disparities, highlight spatial anomalies, and facilitate cross-disciplinary collaboration. By transforming abstract figures into geographic context, thematic maps make complex analytical findings accessible to technical experts and lay audiences alike.
Inherent Limitations and Challenges
Despite their advantages, thematic maps carry inherent risks of misrepresentation if designed poorly or interpreted uncritically. One major challenge is data generalization; aggregating data within broad administrative boundaries can mask localized variation and small-scale hotspots—a phenomenon known in spatial analysis as the Modifiable Areal Unit Problem (MAUP).
Additionally, cartographic visual bias can skew audience perception. Poorly chosen color spectrums, improper data classification schemes (such as equal interval versus natural breaks), or visual distortion caused by large geographic units can mislead viewers. Furthermore, thematic maps are entirely dependent on the quality, accuracy, and currency of the underlying source data; outdated or inaccurate data will invariably produce misleading spatial conclusions.
Modern Tools and Technologies Shaping Map Creation
The process of creating thematic maps has undergone a major technological transformation over recent decades. While cartography was historically a manual, painstaking craft, modern digital tools allow analysts to process vast geospatial datasets and generate complex visualizations rapidly.
- Geographic Information Systems (GIS): Industry-standard software packages such as ArcGIS and the open-source platform QGIS offer comprehensive environments for spatial database management, advanced statistical modeling, and precise map compilation.
- Business Intelligence Platforms: Data visualization software such as Tableau and Microsoft Power BI integrated spatial mapping capabilities, enabling corporate analysts to link financial metrics directly with geographic boundaries.
- Web Mapping and Geospatial APIs: Developers leverage modern web technologies, such as Mapbox, Leaflet, and Google Earth Engine, to build dynamic, interactive thematic maps capable of displaying real-time streaming data directly within modern web browsers.
Frequently Asked Questions
What is the primary difference between a thematic map and a reference map?
A reference map focuses on displaying physical location features, such as roads, rivers, political borders, and mountain ranges, to assist with spatial orientation and navigation. A thematic map focuses on illustrating the spatial distribution and geographic variation of a specific topic, attribute, or statistical dataset.
Can thematic maps be used to analyze historical events and long-term trends?
Yes. Thematic maps are widely used by historians, demographers, and social scientists to visualize historical developments over time. Common examples include mapping territorial shifts, demographic migrations, military troop movements, and changing economic patterns across historical eras.
What software platforms are recommended for beginners entering cartography?
For beginners seeking open-source desktop software, QGIS offers a robust feature set without licensing fees. Beginners looking for intuitive web-based mapping or data visualization often start with platforms like Tableau, ArcGIS Online, or user-friendly web frameworks that streamline data input and layer design.
How does an analyst determine the correct type of thematic map to use?
Selecting the proper thematic map depends entirely on the nature of the data and the analytical goal. Continuous geographic phenomenon (like elevation or temperature) suit isoline maps; aggregated rate or percentage data across established regions suit choropleth maps; and absolute counts at discrete points suit proportional symbol or dot density maps.
Are thematic mapping techniques applicable outside the field of geography?
Yes. Thematic mapping principles are applied universally across public health, economic forecasting, real estate development, sociology, environmental science, logistics management, and political campaigning to analyze geographic relationships within data.