Like many professionals navigating the modern corporate landscape, data storytelling experts find themselves participating in an ongoing real-world experiment with artificial intelligence in the workplace. Almost every day brings new challenges in figuring out where AI genuinely assists and where it ultimately gets in the way. As professionals test these technologies, a central question consistently arises: when is it actually desirable to integrate AI into a specialized workflow?
There are tedious parts of the data storytelling process that practitioners genuinely enjoy, such as tinkering with visual alignment, adjusting color palettes, and sketching rough ideas before committing to a final design. While these preliminary steps might sometimes feel unnecessary to the untrained eye, they almost always result in fresh ideas and a significantly better final output. By contrast, building each chart from scratch or tediously manipulating raw spreadsheet data to produce a non-standard chart rarely improves a professional’s cognitive reasoning. This is the exact phase that creators would happily hand off to an automated assistant, provided they do not lose granular control over the final design. Every minute saved from manually drawing charts is another minute that can be redirected toward thinking deeply about the underlying narrative and design strategy.
Professionals are generally not looking for automated tools to arbitrarily redesign an entire presentation slide from scratch, but they are increasingly open to leveraging technology to produce a solid starting point that can be refined and polished. A recent practical test of this collaborative approach is beginning to shift how modern data analysts and designers approach their daily work.

One Chart That Is Trying to Do Too Much
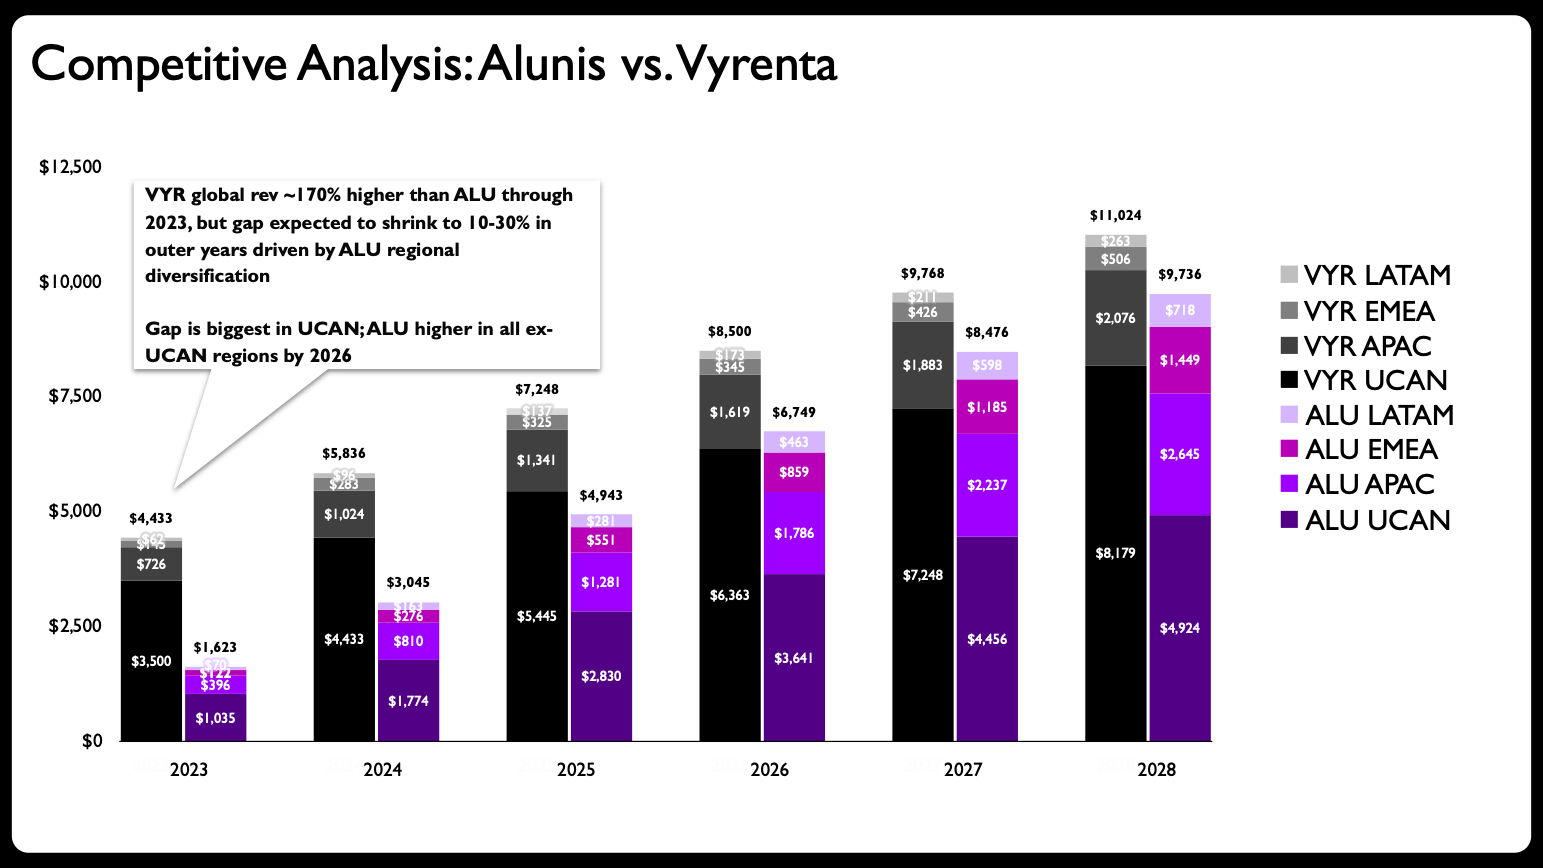
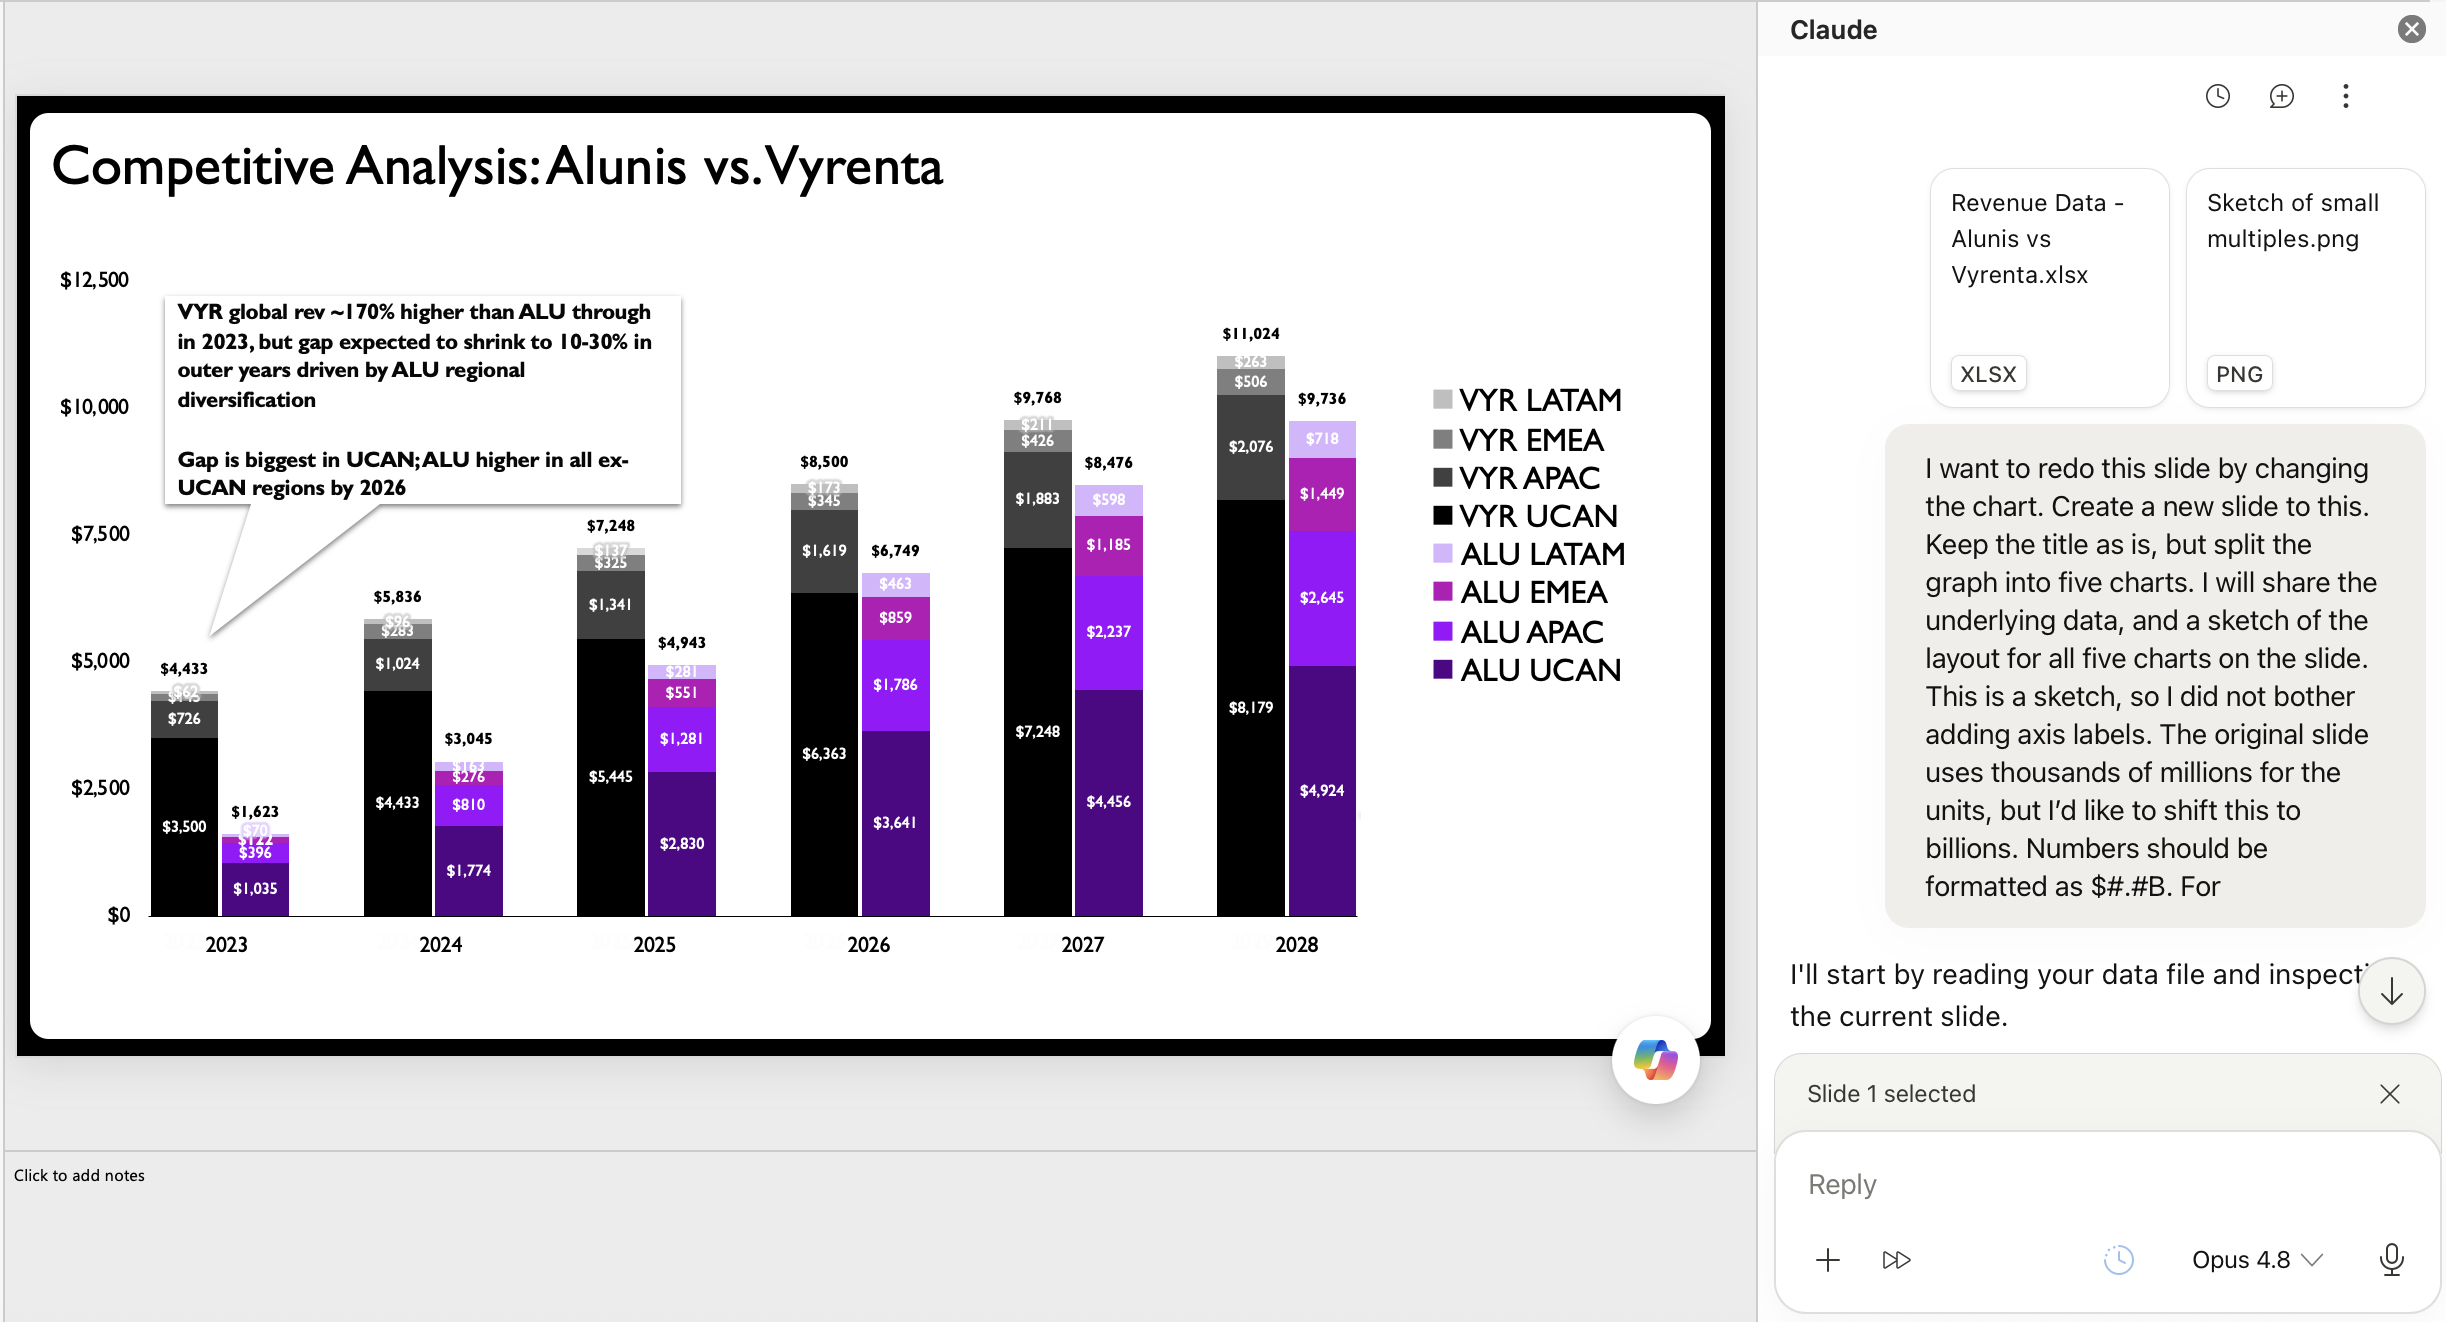
A recent client project provided the ideal testing ground for this hypothesis. In the original scenario, a stacked bar chart was deployed to illustrate how a rising challenger company, Alunis, planned to close a significant revenue gap with a top market competitor, Vyrenta, by focusing on regional market expansion over time.
The initial assessment of the visual revealed a classic design dilemma: the chart was simply trying to do too much at once. The overarching goal was to show how Alunis would narrow the revenue deficit over a multi-year period, compare the two corporate entities side by side, and simultaneously display the regional composition of each company’s sales. That is an immense amount of heavy lifting for a single visual element to communicate effectively.
Data visualization experts frequently warn against the most common mistake in graphic design: packing too much information into one graph. The logical first step for a proper makeover is to avoid this trap by breaking down the congested graph into multiple, digestible charts. This is where the workflow begins to pivot into new territory.
Partnering with AI for Efficient Layouts
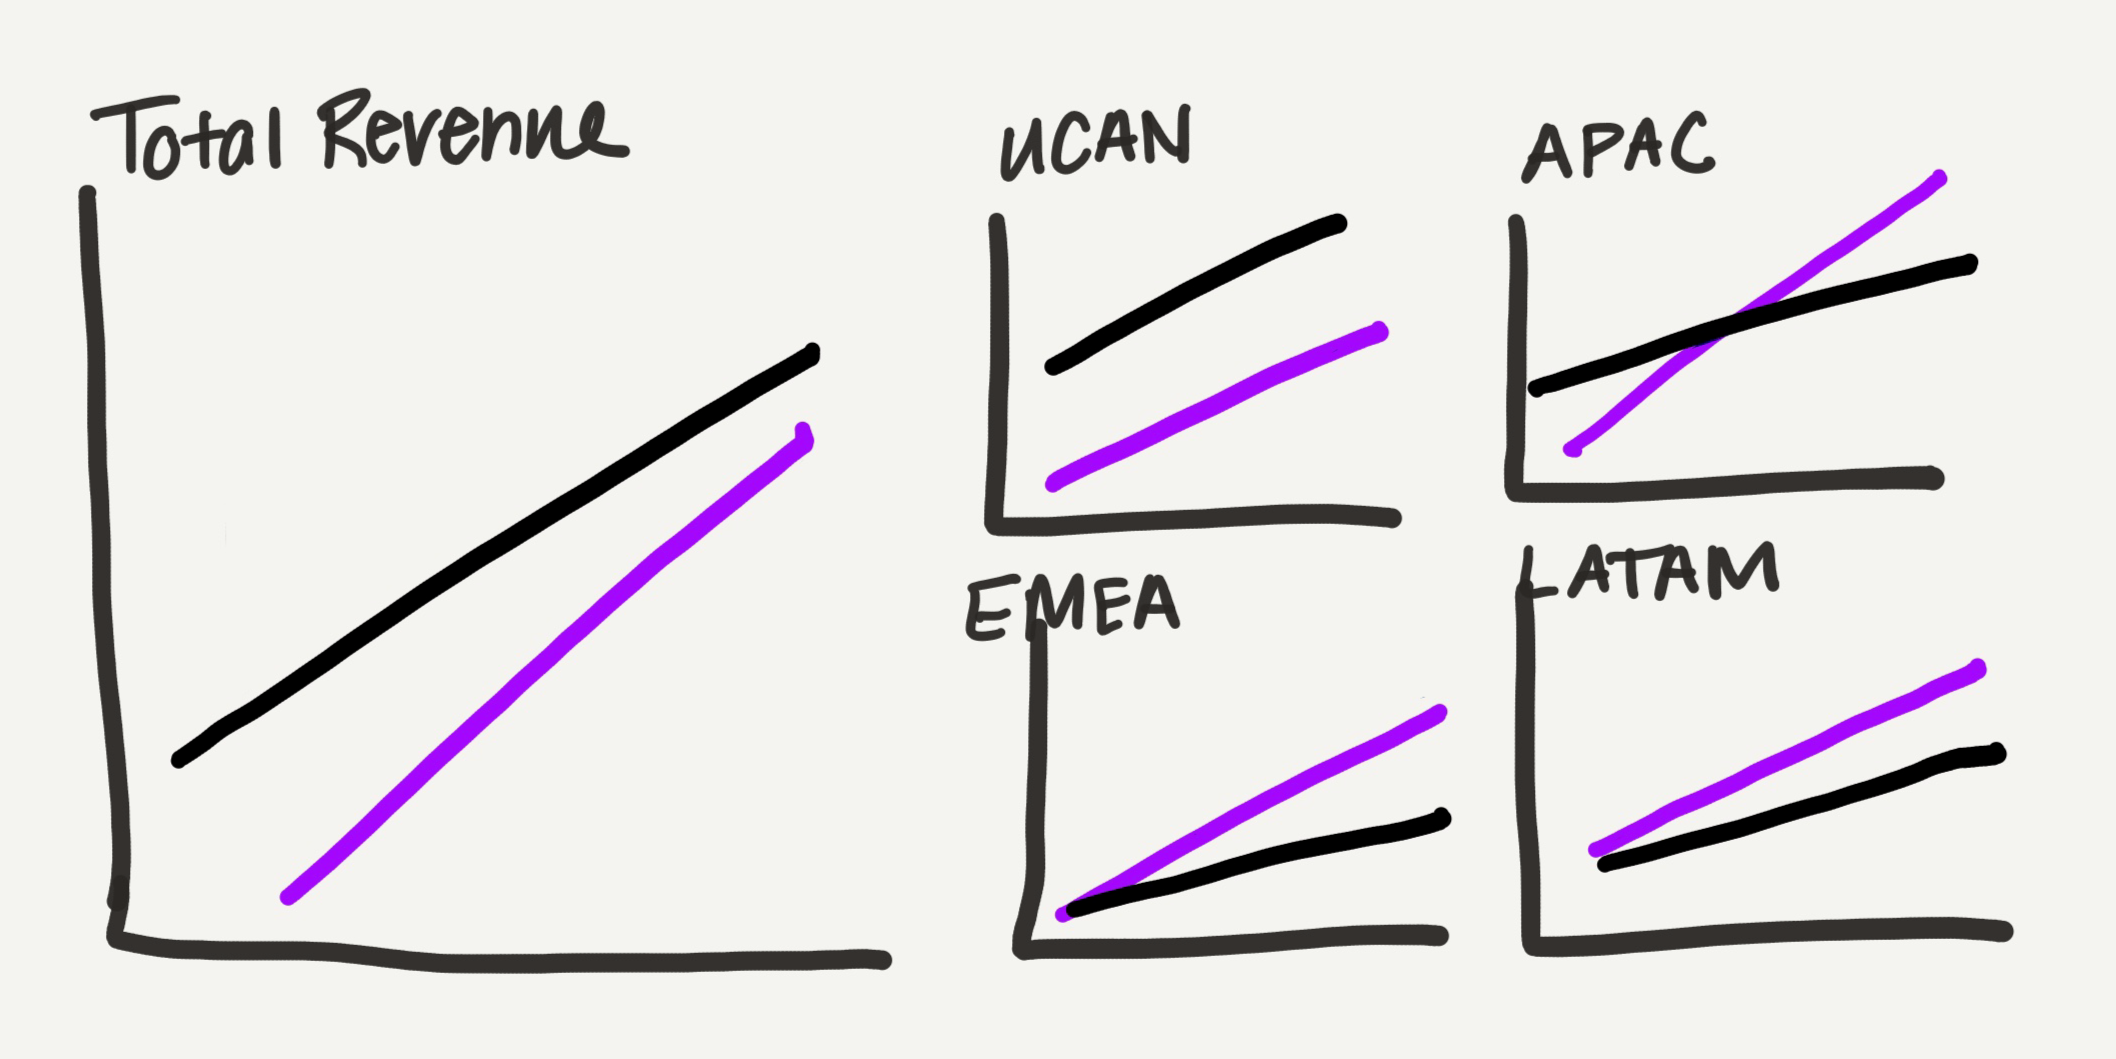
Because physical sketching remains a vital part of iterating on design concepts, the practitioner created a rough, hand-drawn draft of how a multi-chart redesign could look.
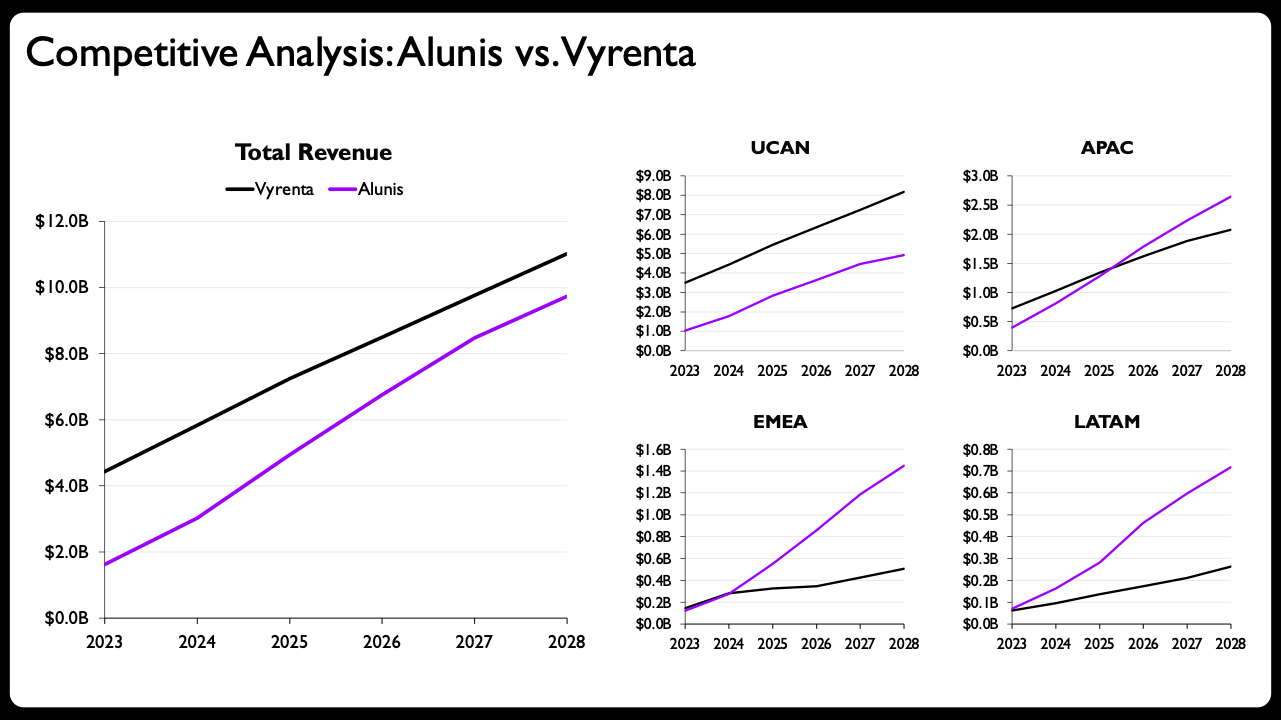
Rather than sticking with bulky bar charts, the design shifted toward line charts, which possess a much lighter visual footprint—a distinct advantage for a presentation slide burdened with substantial data. The graphs were systematically divided by geographic location: one overarching graph dedicated to total revenue, accompanied by a dedicated chart for each distinct global region. Instead of maintaining a uniform size across all panels, the total view was rendered larger, while the four regional charts were arranged into a compact grid that occupied roughly the same total space as the main view. This deliberate layout serves as a subtle, intuitive way to visualize the data’s part-to-whole nature without overwhelming the viewer.
In the pre-AI era, creating each of these individual graphs manually inside presentation software would have consumed a tremendous amount of time, patience, and mental energy.
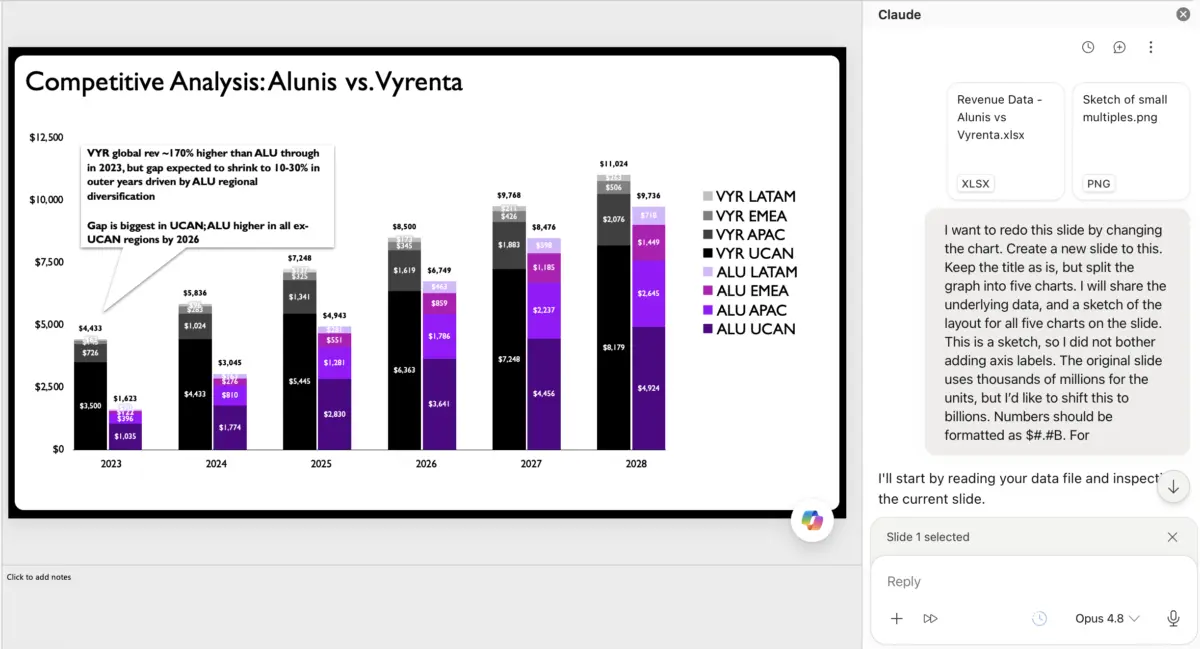
This time around, however, the designer shared the hand-drawn sketch and raw data directly with an AI assistant. Having experimented with various integrations over preceding months, the practitioner found that specific presentation add-ins designed for native slide software offered the most practical utility because they generated fully editable charts directly within the preferred authoring environment.
That native editability is what makes this collaborative experiment truly viable. While other major technology platforms offer chart-generation capabilities with varying degrees of success, the ability to manipulate the underlying data series and visual axes directly within the slide application is essential for maintaining professional standards.
The output generated by the AI assistant based on the rough prompt and uploaded sketch proved to be remarkably competent. It represented an immediate, marked improvement over the congested stacked bars of the original slide, successfully translating the multi-panel concept into structured visual components.
The Value That Human Judgment Brings
For many corporate communicators, simply rewriting the slide title and adding brief descriptive text above the AI-generated charts might be considered more than enough to call the project finished.
For dedicated data storytellers, however, stopping there leaves too much potential on the table. A handful of precise, intentional tweaks are required to elevate the visual communication to the next level.
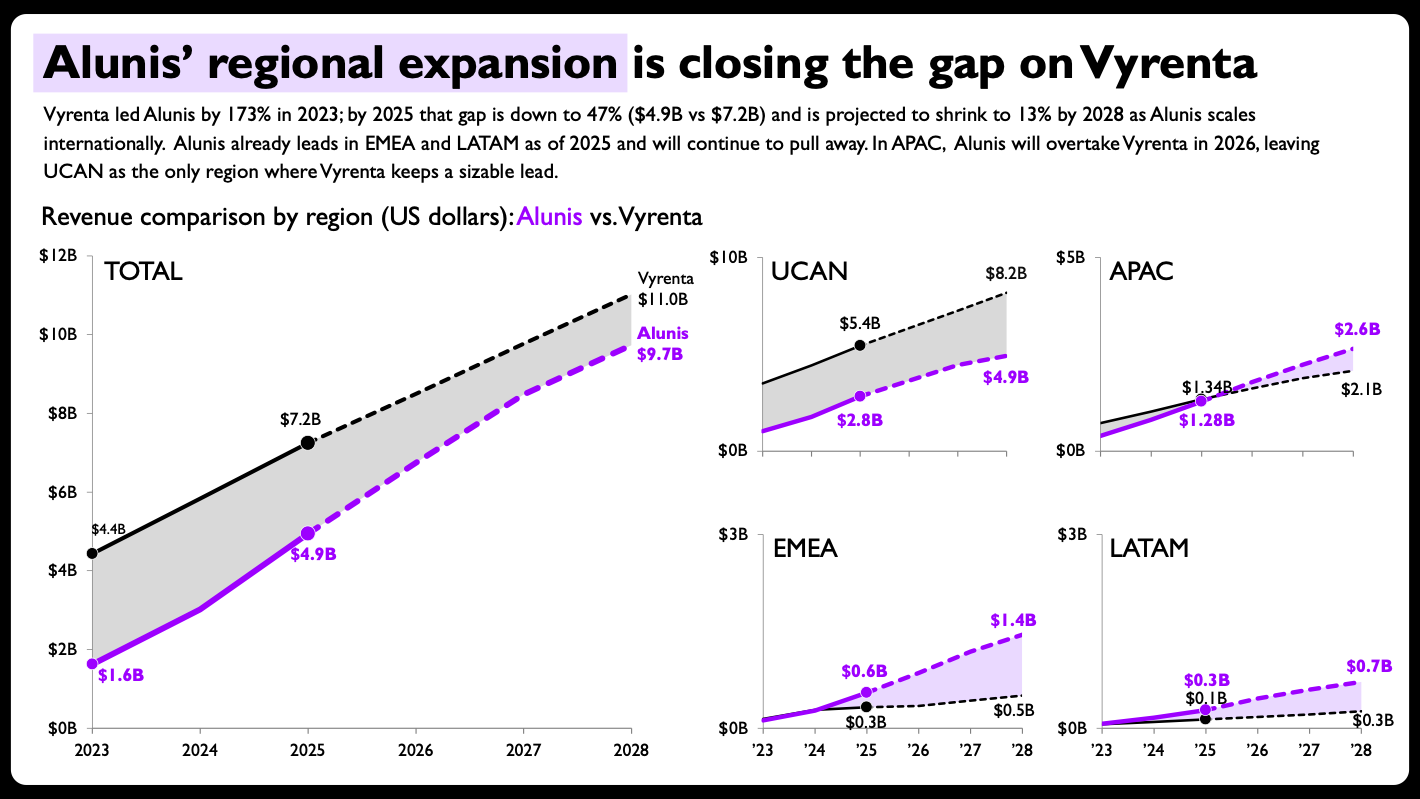
The final version of the design incorporates several critical refinements that showcase human expertise. Shaded areas were introduced between the competing lines to emphasize the revenue gap, and direct end-of-line labels with explicit values were added to eliminate the need for a distracting separate legend. The per-panel axis ranges were purposefully scaled to suit each individual region rather than locked into a rigid universal scale, acknowledging regional volume differences. Furthermore, solid versus dashed lines were deployed to cleanly separate historical actual figures from future projections, while compact year formatting was applied to the smaller panels to reduce visual clutter.
The resulting redesign stands as a strong testament to a successful partnership between human creativity and artificial intelligence. Such outcomes are not guaranteed in every AI experiment, and the difference invariably comes down to the availability of editable output.
The Broader Implications for Professionals
A major hurdle for many practitioners in the past was that AI-generated charts were often delivered as static, uneditable images, frequently marred by processing inaccuracies. That limitation made it imperative for professional designers to painstakingly recreate visuals from scratch. Now that advanced AI tools are capable of generating solid, editable charts and slides, they have finally evolved into genuinely useful additions to an existing data storytelling workflow.
The implications of this shift extend well beyond experienced specialists. For individuals who are relatively new to data storytelling or who feel uncertain about how to construct a specific type of chart in professional software, AI can serve as a bridge to help overcome the initial steep learning curve.
Crucially, however, automation does not eliminate the need to understand the foundational principles that govern effective output. Executing this AI-assisted makeover still required the practitioner to recognize that a stacked bar chart was fundamentally flawed for the scenario. It required human judgment to determine a clean, legible layout for multiple charts on a single slide, and it required deliberate design choices to decide when breaking conventional rules—such as maintaining consistent axis scales across panels—was pedagogically sound. Throughout the process, the human professional remained firmly in the driver’s seat.
This dynamic highlights the unique value that human professionals continue to contribute in the modern workplace. Practitioners provide critical oversight, contextual judgment, and strategic direction, while artificial intelligence accelerates the mechanical execution of tasks. For many in the field, offloading the tedious execution while retaining creative control represents an engaging and welcome evolution in the practice of data storytelling.