In the modern professional landscape, data is generated at an unprecedented scale. From automated analytics dashboards to rapid-fire artificial intelligence assistants, software tools can assemble charts, graphs, and visual summaries in mere seconds. These applications often apply automatic coloring and styling by default, producing polished graphics instantly. However, a fundamental challenge remains: software algorithms and automated systems do not inherently know which data points matter most to a specific audience. Deciding where attention should be directed is a responsibility that rests entirely with the communicator.
When used thoughtfully and sparingly, color is frequently one of the quickest and most effective mechanisms for improving a graph’s clarity. Rather than serving as an aesthetic afterthought or a default setting applied by a graphing utility, color should represent an explicit choice designed to guide the viewer. For professionals who struggle with implementing this philosophy within standard productivity applications like Excel, Microsoft Word, or PowerPoint, understanding the mechanics of strategic visual design is essential for transforming cluttered outputs into compelling narratives.

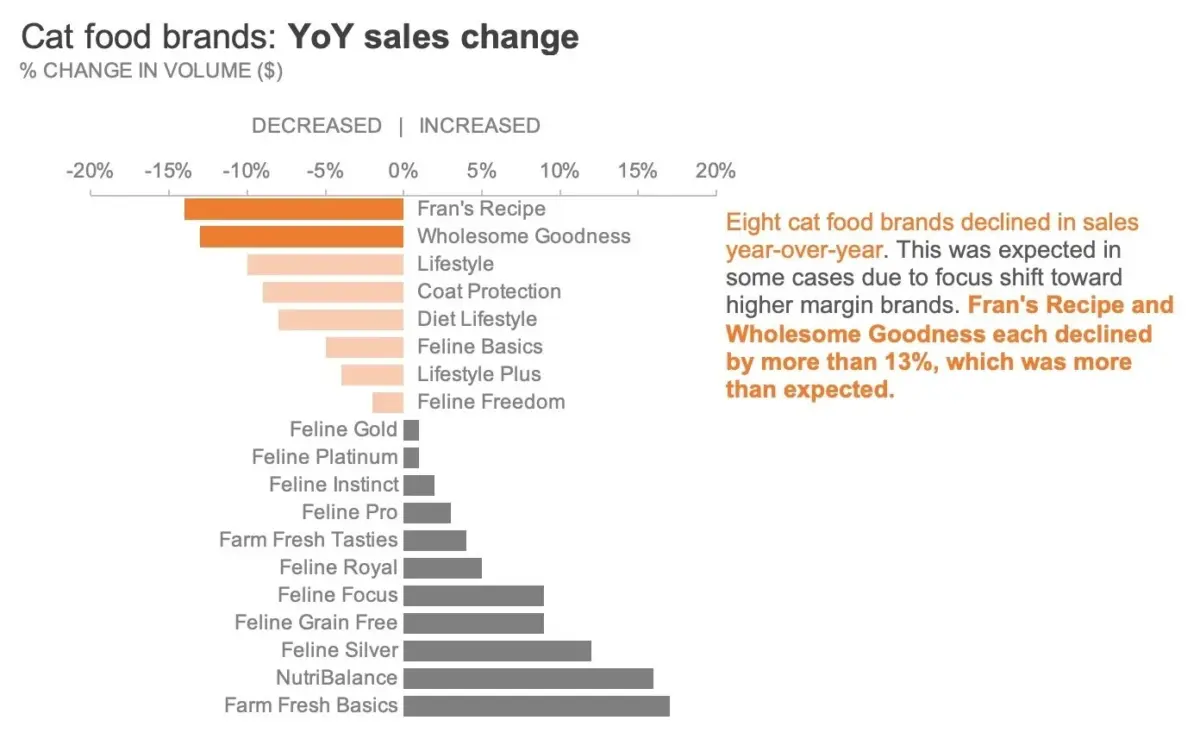
To explore these principles in practice, experts often point to specific real-world examples, such as the year-over-year sales change data for cat food brands manufactured by a pet products company. Featured in exercise resources designed for data storytelling practitioners, this dataset provides a clear foundation for examining how visual adjustments impact audience comprehension.
Starting in Greyscale
A reliable foundational approach to effective data visualization begins with a neutral palette of greyscale tones, applying color exclusively to the specific elements where the audience’s focus is required. Utilizing a greyscale chart establishes a clean, neutral baseline. It also serves as a practical reminder for the creator that additional refinement is necessary before a graphic is finalized for presentation, making it significantly easier to be deliberate about color placement later in the design process.
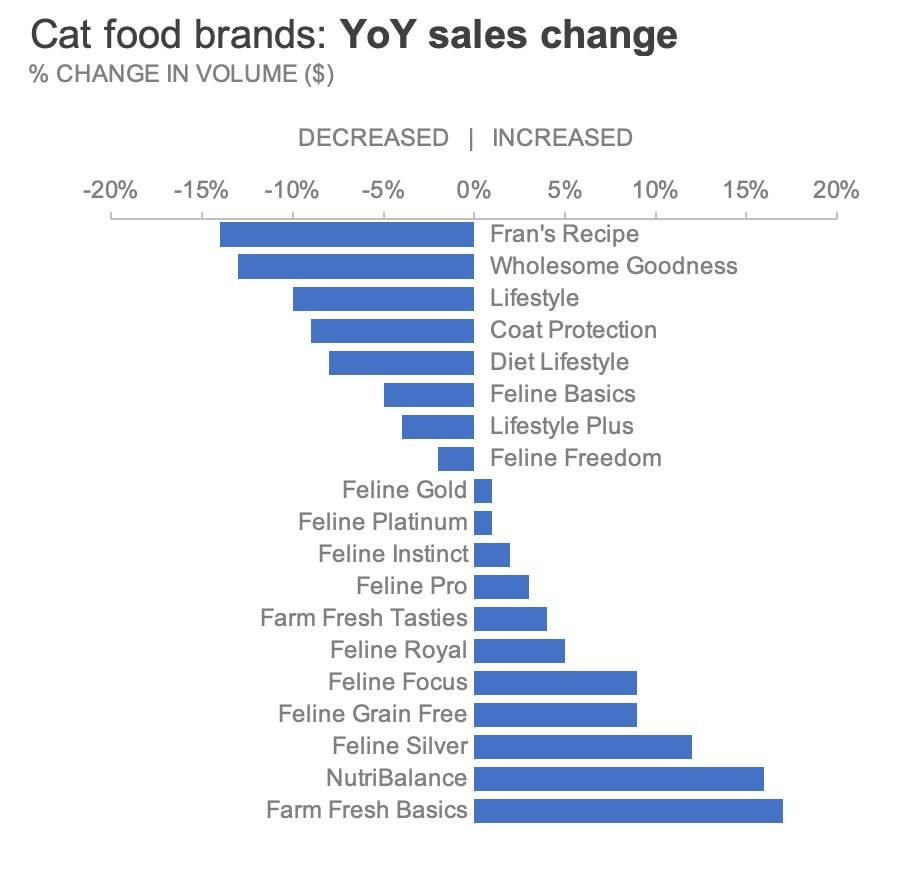
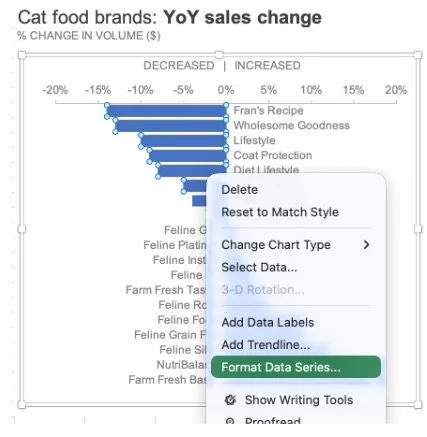
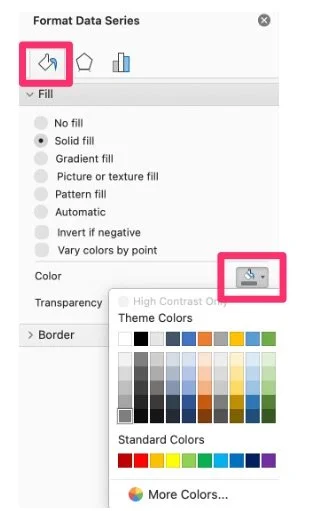
The transformation typically begins by removing default software color schemes and replacing them with a uniform shade of neutral grey. In standard spreadsheet applications, this can be achieved through formatting menus by accessing the fill and line properties of the data series. Once a clean greyscale version of a chart has been established, professionals often save the layout as a reusable template, streamlining future reporting workflows and eliminating the need to repeatedly execute manual formatting steps.
Highlight What Matters
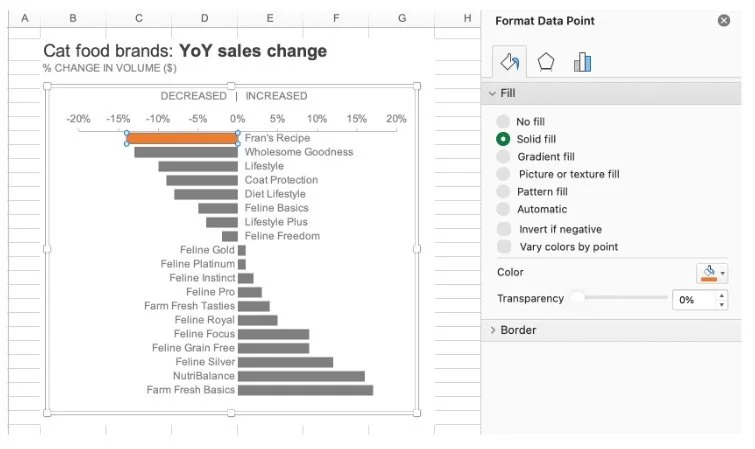
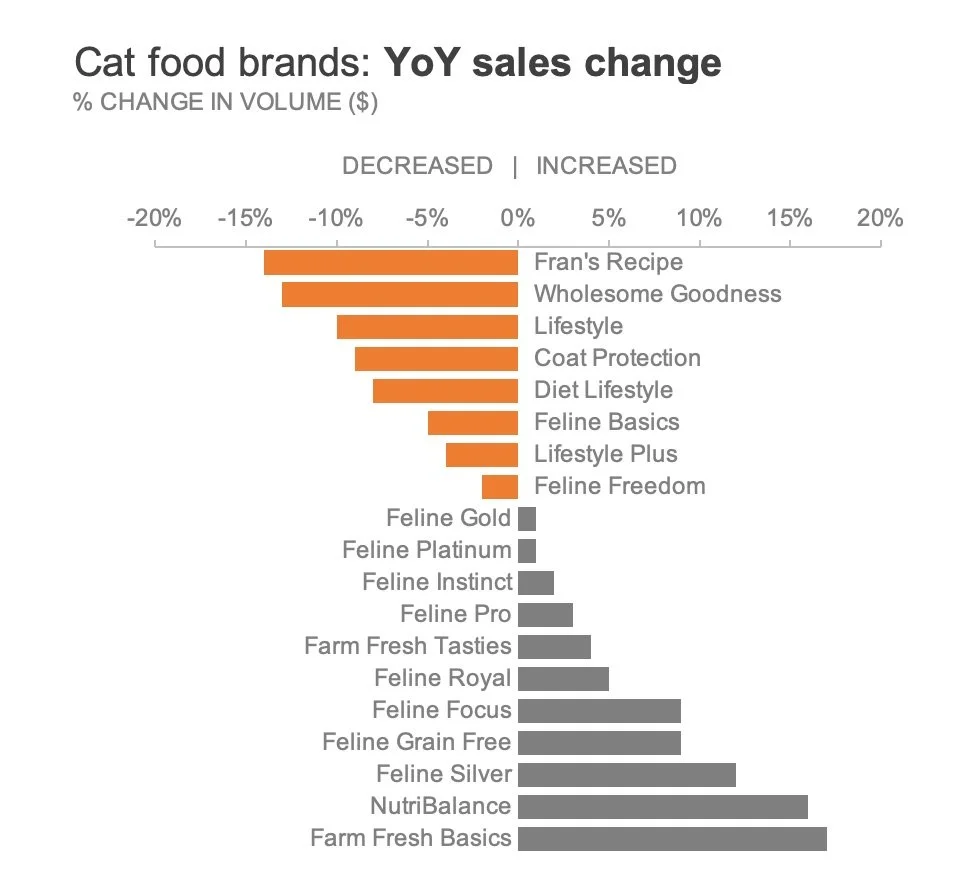
Consider a scenario where an analyst needs to call attention specifically to the pet food brands that experienced a decline in sales year over year. To draw focus to these underperforming segments, the designer can choose to apply color exclusively to the relevant bars while leaving the remaining data points in neutral grey. To maintain strong accessibility standards—ensuring that visuals remain
inclusive for individuals with common forms of color vision deficiency—designers frequently avoid traditional red, opting instead for orange, a distinct hue that naturally reinforces a negative sentiment or downturn.
Applying selective color in spreadsheet software involves isolating individual data points rather than modifying an entire series at once. By carefully selecting specific bars and adjusting their individual fill properties, creators can ensure that only the targeted data elements stand out. Shortcuts such as repeating previous formatting actions can further accelerate this process when handling multiple data points across a complex chart.
However, visual hierarchy often requires nuance beyond a simple binary distinction between positive and negative performance. Imagine that within the group of declining brands, the analyst wants to place extra emphasis on the two specific entities that suffered the most severe drops: Fran’s Recipe and Wholesome Goodness. Applying the primary orange highlight to all declining brands while keeping everything else grey effectively signals negative growth, but it risks obscuring the distinction between moderate declines and catastrophic drops.
To solve this, designers can vary the intensity of the color to establish a clear secondary hierarchy. This can be accomplished through several design techniques available in standard spreadsheet and presentation tools. One method involves manually selecting a paler or lighter shade of orange for the less severely impacted brands, ensuring the most critical negative changes retain the strongest visual weight. Alternatively, creators can maintain a uniform hue while adjusting transparency levels within the fill settings, or layer subtle, semi-transparent shapes over specific bars to soften their appearance without entirely obscuring the underlying data. By varying color intensity in this manner, an organization can highlight an entire category of concern while simultaneously drawing immediate attention to the most urgent outliers.
Include Words for Clarity
Visual elements alone are rarely sufficient when a chart must be consumed independently by an audience. If a presenter is not available to walk stakeholders through the information in real time, pairing the designed chart with concise explanatory text is vital for ensuring the core message is understood.
Incorporating a targeted text annotation directly adjacent to the visual data—with key terms bolded and matched to the exact orange hue used in the graph—creates an immediate visual bridge between the narrative and the numbers. This deliberate connection allows viewers to grasp the intended takeaway within seconds, bridging the gap between raw metrics and actionable insight.
Ultimately, color should always support an underlying message rather than distract from the underlying data. The most effective professional charts rely on restrained palettes, purposeful highlighting, and clear contextual wording to guide audiences smoothly to the intended conclusion. As organizations continue to rely heavily on data-driven decision-making, mastering these foundational design principles remains a critical skill for clear, impactful professional communication.