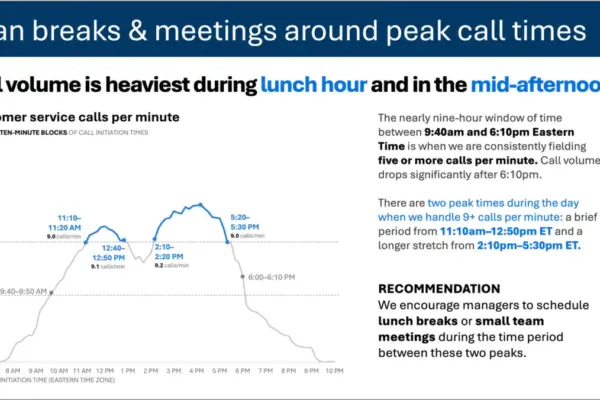
As professionals increasingly turn to artificial intelligence to streamline their workflows, the gap between a rudimentary draft and genuinely effective communication has never been more apparent. The latest installment in the ongoing SWD + AI series tackles the critical phase of data storytelling where visuals are actually designed, refined, and woven into a cohesive presentation. Whether generated by traditional charting tools or modern AI platforms, raw graphs and initial slide layouts are rarely ready for prime time. They require deliberate decluttering, sharpened focus, and precise copywriting to bridge the distance between simply informing an audience and compelling them to act.
This phase of the workflow is traditionally where professionals spend the bulk of their time. However, industry experts note that introducing AI into the design process—provided it receives the right context and direction—can handle much of the heavy lifting. Instead of building each slide entirely from scratch, presenters can describe their needs, share their underlying data, and prompt AI to generate a functional first version. While this initial output is rarely perfect, arriving at a viable starting point in minutes rather than hours fundamentally changes what is possible in corporate communications and data presentation.
Unlike earlier stages of the storytelling process where AI primarily acts as a standalone thought partner for brainstorming or prototyping, the latest guidance emphasizes using AI integrated directly into applications like PowerPoint. This integration ensures that the resulting outputs are fully editable slides rather than static images. Presenters are no longer merely evaluating conceptual prototypes; they are actively building and refining the real thing in place, using AI to execute micro-adjustments and structural updates efficiently.
To achieve professional results, this workflow relies heavily on established design principles aimed at reducing cognitive load—the mental effort required for an audience to process visual information. Every element added to a slide or graph demands cognitive processing power, meaning that anything failing to add informative value functions as clutter. Effective design does not pursue minimalism for its own sake; rather, it strips away extraneous elements—such as redundant chart borders, heavy gridlines, unnecessary tick marks, and default formatting applied automatically by software tools—so that the essential data stands out clearly.
Visual order is another foundational pillar of effective slide design. When elements such as text blocks, graphs, and headers are misaligned, the slide subconsciously feels disjointed and unprofessional to the viewer. Consistent alignment creates an invisible structural framework that allows the audience to navigate content smoothly. When design is executed thoughtfully, it recedes into the background, leaving the audience entirely focused on the narrative rather than distracted by formatting flaws.
Even a clean and well-aligned visual, however, still leaves viewers to decide independently what matters most—a risk that can easily derail a presentation if the audience focuses on the wrong data points. To counter this, presenters must actively guide attention using strategic emphasis. Elements such as restrained color palettes, proportional sizing, and deliberate positioning create a natural visual hierarchy. By highlighting a single data point against a neutral field or making critical takeaways physically larger, presenters can make the right conclusion obvious without resorting to explicit verbal directions.
Language plays an equally vital role in bridging the gap between raw data and audience comprehension. Every graph requires a descriptive title to ground the viewer, while every slide needs a definitive takeaway title—a complete sentence that preemptively answers the unspoken question of why the data matters. Axes must be clearly labeled, and key data points should be annotated only when they genuinely enhance meaning. Upholding strict editorial discipline ensures that every word earns its place, cutting through noise to preserve clarity.
Organizational branding guidelines also serve a vital function in professional presentations. Utilizing standardized templates, approved color palettes, and consistent typography goes far beyond mere aesthetics; it signals organizational credibility and maintains visual consistency across enterprise communications. Aligning drafts with a company’s established identity before applying broader design principles ensures that the final presentation resonates smoothly with internal and external stakeholders alike.
To maximize the effectiveness of AI during the design phase, practitioners are encouraged to provide comprehensive foundational materials before generating slides. Sharing specialized primers, such as the official SWD + AI reference guide, helps ground artificial intelligence tools in core data storytelling principles. When AI models understand these specific design philosophies, their initial output improves markedly compared to unguided prompting.
Working within integrated environments like Copilot in PowerPoint allows users to bring existing drafts or raw data tables directly into the workspace alongside a set of clear parameters. Presenters typically outline their specific audience, define the single-sentence takeaway the slide must communicate, and clarify the intended format—such as a standalone report graphic or a slide within a live corporate briefing. This targeted approach allows AI to complete roughly ninety percent of the structural and layout work rapidly.
The remaining ten percent of the process relies entirely on human judgment. Presenters review the AI-generated foundation, applying final refinements to color emphasis, wording precision, and spatial alignment. Some of these adjustments are executed directly through further AI prompts, while others are polished manually.
This methodology forms part of a broader narrative arc within the ongoing professional series. Practitioners following the framework typically begin by establishing context and identifying a core business problem, progress through narrative planning and visual selection, and ultimately arrive at the slide design phase. By combining structured human strategy with the speed and adaptability of integrated artificial intelligence tools, data professionals can produce polished, impactful presentations that effectively move their audiences from insight to action.