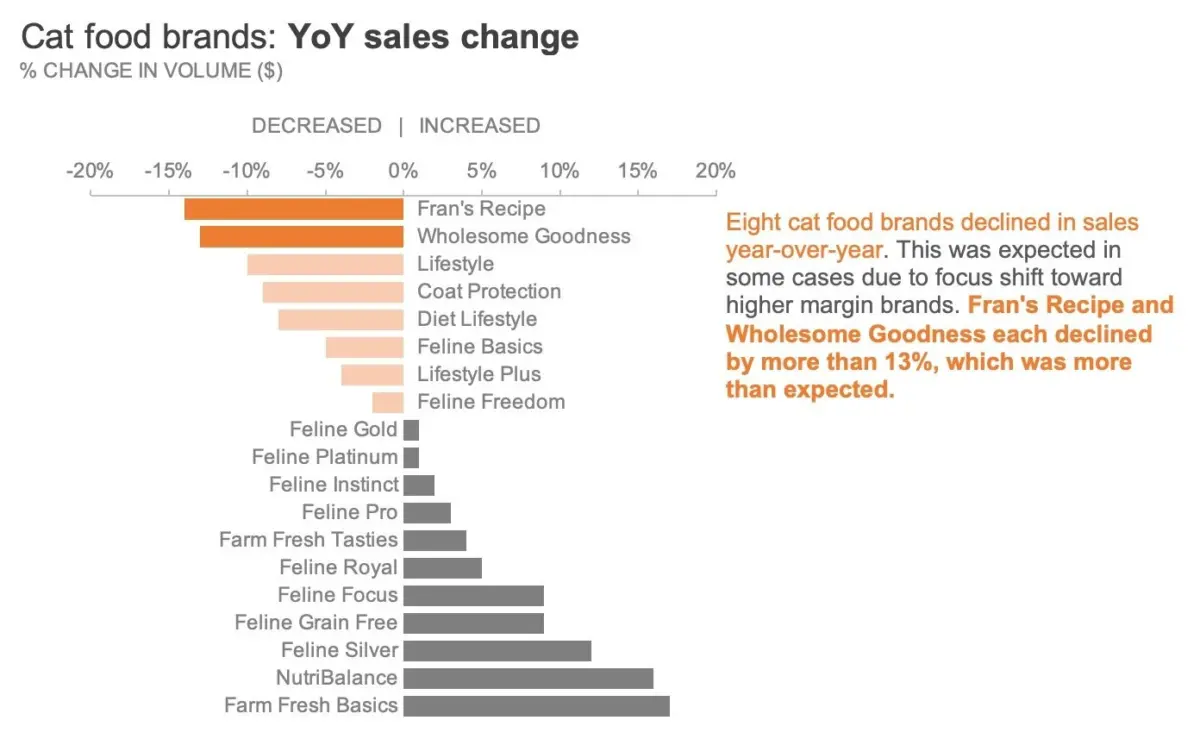
In the modern corporate and analytical landscape, the sheer velocity at which data can be generated is astonishing. With just a few clicks, modern spreadsheet software, advanced graphing tools, and automated artificial intelligence assistants can construct a fully polished chart in a matter of seconds. These technologies are even capable of applying automated highlights or dynamic color schemes on their own. Yet, despite these impressive technological leaps, software fundamentally lacks a critical capability: it does not know which piece of data matters most to your specific audience.
That vital decision remains squarely in the hands of the communicator. According to communication experts and data visualization specialists, one of the most effective and rapid ways to dramatically elevate the clarity of any graph is to use color sparingly and with deliberate, explicit intent. Rather than relying on the default color palettes automatically assigned by software applications—which frequently result in visual clutter and confused messaging—analysts must take conscious control of their visual vocabulary.

To explore this philosophy in practical terms, industry professionals often turn to proven exercises, such as those featured in educational resources like storytelling with data: Let’s Practice!. A classic case study involves examining a standard corporate sales report from a pet food manufacturer, specifically tracking the year-over-year performance metrics across various cat food brands. By analyzing this dataset, communicators can learn how to strip away unnecessary visual noise and direct their audience’s attention precisely where it needs to go.
Start in Greyscale
A fundamental philosophy in effective data design is to begin the visualization process entirely in neutral shades of grey before introducing any chromatic elements. Building a chart using only greyscale establishes a clean, objective foundation and serves as a helpful psychological reminder that additional refinement is required before the graphic is ready for public presentation.
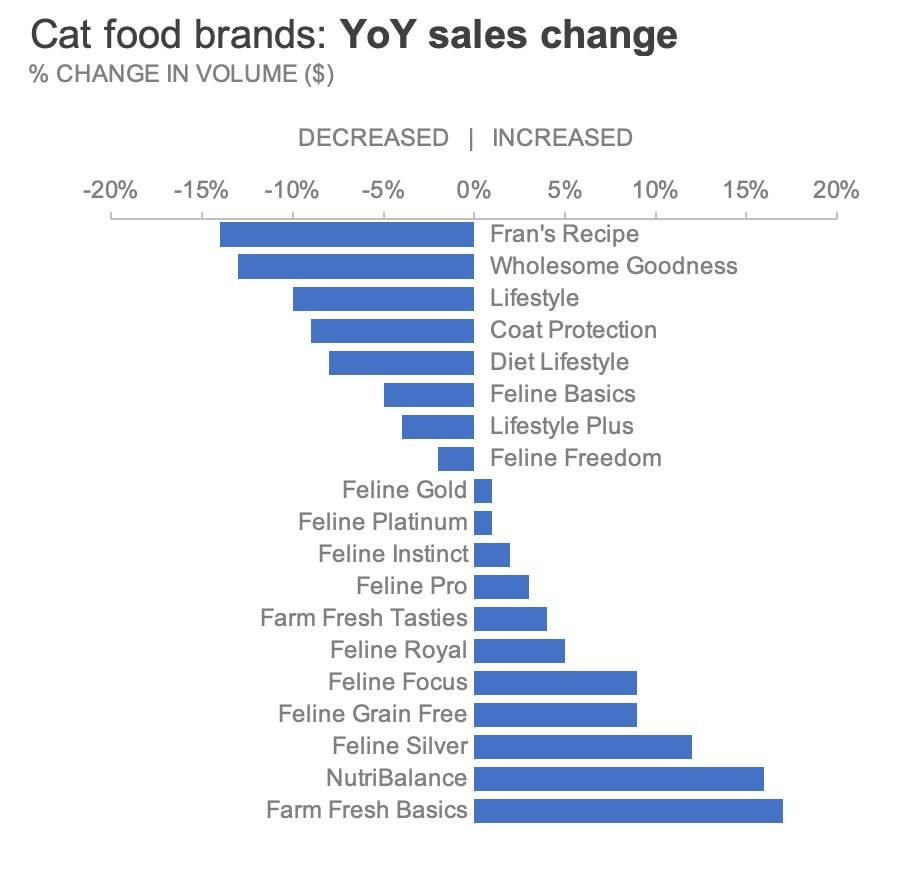
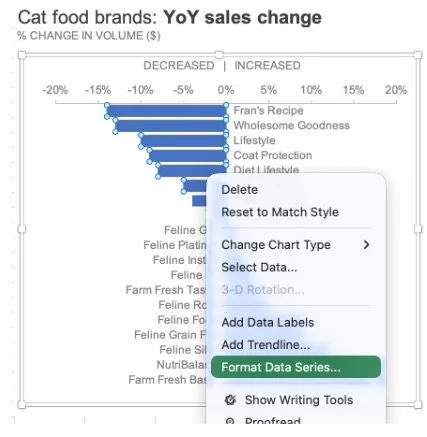
When a chart is rendered entirely in monochromatic tones, it removes the distraction of competing colors and forces the creator to be deliberate about where color truly belongs. In standard software environments like Microsoft Excel—whether working directly within the spreadsheet application or managing charts embedded inside Microsoft Word documents or PowerPoint presentations—this transition begins by accessing the formatting controls. By right-clicking the data series and navigating to the fill settings, creators can systematically strip away default program colors and replace them with a neutral grey hue.
This technique applies equally whether a chart contains a single data series or multiple complex categories. Repeating the process until the entire visualization exists in a balanced greyscale state ensures that every subsequent design choice is intentional. Once a clean, neutral baseline has been established, experienced analysts frequently save the layout as a reusable template, streamlining future reporting workflows and ensuring brand consistency across organizational communications.
Highlight What Matters
Once a neutral greyscale foundation is firmly established, the strategic application of color becomes an exercise in signal-to-noise optimization. Consider a scenario where a business analyst needs to draw executive attention toward the specific pet food brands that experienced a decline in sales over the previous year. To achieve this, the analyst can choose to isolate and color only the data points representing negative growth, leaving the remaining successful brands in neutral grey.
In modern data design, accessibility considerations play a major role in palette selection. Rather than instinctively defaulting to red—a hue that can carry unintended psychological connotations or present visibility challenges for individuals with color vision deficiencies—designers often opt for a burnt orange. This particular hue reinforces a negative performance trend while remaining visually harmonious and accessible to a broader audience.
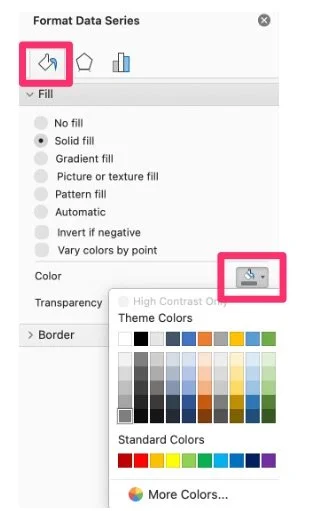
Executing this in spreadsheet software involves isolating specific data points rather than altering an entire data series simultaneously. By selecting an individual bar, accessing the format pane, and applying a solid fill of the chosen accent color, an analyst can manually spotlight critical performance dips. For those working across multiple data points, shortcut commands within operating systems allow creators to quickly repeat formatting actions, ensuring efficiency while maintaining precise control over the visual output.
However, advanced visual storytelling often requires nuanced differentiation even within a highlighted subset. Imagine a situation where, among all the declining cat food brands, leadership needs to focus specifically on the two most severe drops: Fran’s Recipe and Wholesome Goodness. If every declining brand were rendered in the exact same shade of solid orange, the subtle hierarchy between moderate declines and catastrophic drops would be lost.
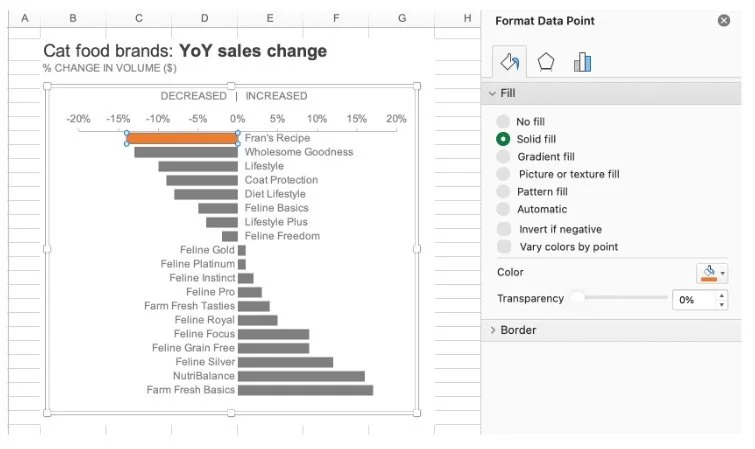
To solve this challenge without cluttering the graphic, designers can vary the intensity of the color. This can be accomplished through several methods, such as manually selecting paler hues for lesser declines, adjusting color transparency settings within the software’s fill menu, or layering semi-transparent geometric shapes over specific data columns. Each technique allows the creator to maintain the broader signal of negative year-over-year growth while simultaneously pulling the audience’s eye toward the most critical outliers.
Include Words for Clarity
Even the most thoughtfully designed chart can fall short if it is stripped of its context and presented to an audience expected to consume the information entirely on their own. When a communicator is not physically present to walk stakeholders through the nuances of a slide or report, the visual elements must be paired with explicit, explanatory text.
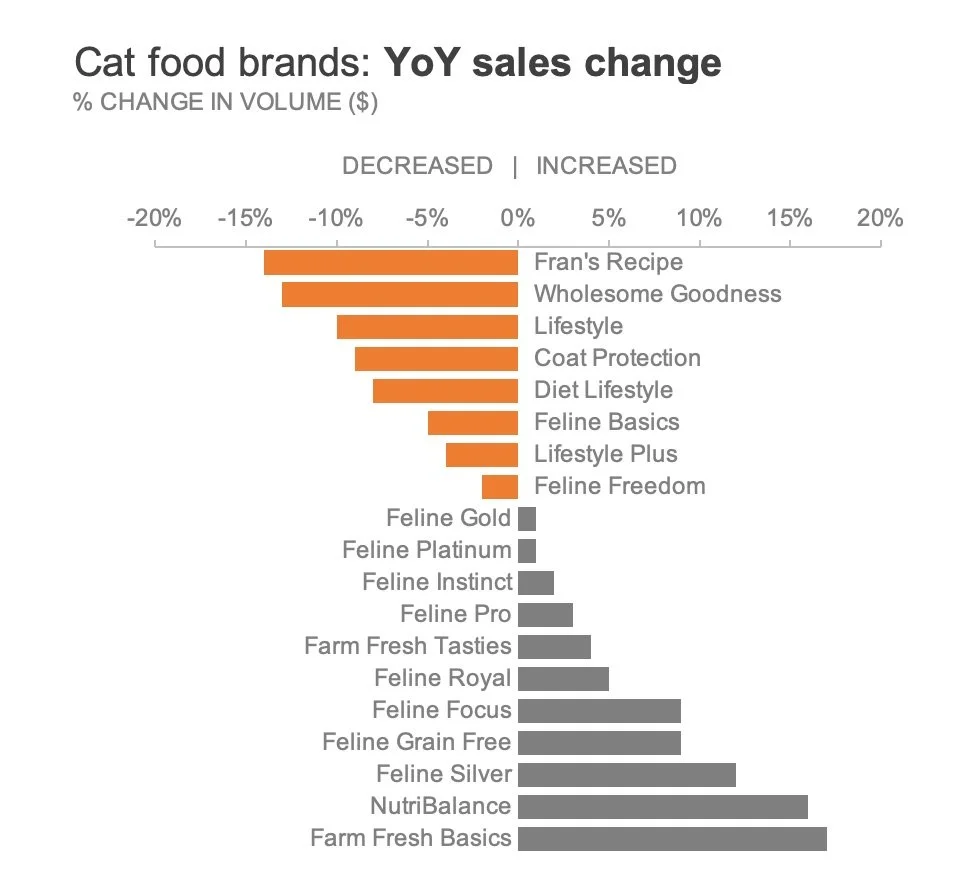
Integrating targeted text annotations directly next to the relevant data points bridges the gap between raw numbers and actionable insights. By incorporating key phrases into the commentary and coloring specific highlighted words to match the accent shade used in the chart—such as the burnt orange applied to declining sales metrics—designers create an immediate visual bridge between the narrative and the quantitative evidence. This dual-coding approach ensures that even rushed readers can instantly grasp the intended takeaway within seconds.
Ultimately, color should act as a supportive pillar for a core business message rather than a decorative distraction that obscures underlying trends. The most effective corporate charts rely on restrained palettes, purposeful highlights, and crystal-clear explanatory language to guide decision-makers seamlessly from data observation to strategic action.