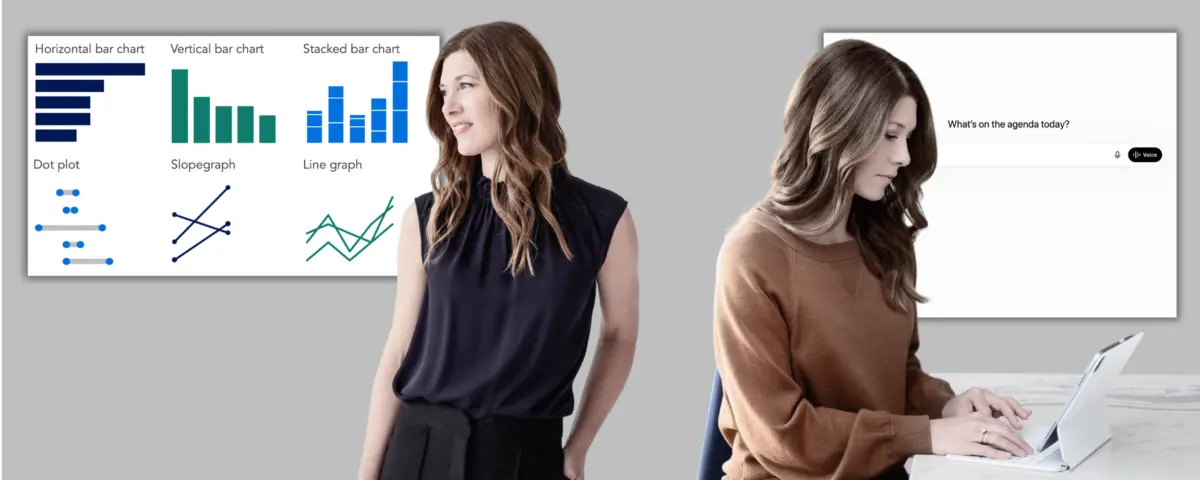
In the modern landscape of data-driven decision-making, the intersection of artificial intelligence and professional storytelling is reshaping how organizations communicate complex information. As analysts and communication professionals strive to make their data resonate, selecting the right visual representation remains a foundational challenge. Standard visual formats serve distinct purposes: bar charts compare metrics across categories, dot plots and slopegraphs emphasize change between two specific points, and line graphs reveal trends over time. When in doubt, professionals are advised to rely on familiar formats to ensure audiences grasp the core message immediately without needing to decode an unfamiliar visual structure. Introducing less common graph types is only warranted when they reveal insights that would otherwise remain obscured.
Choosing an effective visual is rarely a straightforward path from an initial concept to a finished graphic. Professionals often draft one format, recognize that it emphasizes the wrong elements, and pivot to another to get closer to their communicative goal. This iterative process of experimenting with different views of the same dataset to find the one that best serves the core message is precisely where artificial intelligence can accelerate productivity. Although AI outputs are frequently rough and require some back-and-forth refinement, they allow teams to prototype multiple options quickly. Rather than spending valuable hours building a polished chart only to realize the format fails to support the takeaway, practitioners can evaluate various perspectives against their core message and commit to a clear direction before investing in a final build.
Working with AI to Choose an Appropriate Visual
For professionals following a structured communication workflow, the foundational takeaway titles established during the storyboarding phase already outline what needs to be shown. However, for those approaching the visualization process independently or operating in an exploratory mode, artificial intelligence can assist in determining what metrics are worth visualizing in the first place. By sharing raw data and asking the system to surface underlying patterns or noteworthy trends, analysts can identify compelling angles. Once an interesting trend emerges, pausing to articulate the takeaway in a single sentence is essential before moving into prototyping. This crucial articulation step transforms a raw prototype into a purposeful visual.
From there, the workflow is remarkably straightforward. Analysts can articulate what they want to communicate, share their dataset, and ask the system to suggest several options. There is no strict requirement to clean or aggregate the data prior to this step, as handling messy inputs is part of what modern AI tools can manage. For each generated prototype, users should prompt the system to explain the tradeoffs, detailing what each option makes easy to see and what it obscures. The objective is not to delegate the final decision to the algorithm, but rather to use technology to rapidly surface diverse options that can be evaluated using professional judgment, audience awareness, and strategic goals.
Once a strategic direction is chosen, the chart can be constructed within a preferred software tool, either independently or with the assistance of integrated AI features. Regardless of how the final graphic is produced, the human creator remains entirely responsible for the accuracy of the displayed information. Before diving into specific prompts and practical examples, however, professionals must account for several potential pitfalls regarding the capabilities of current technology.
Understanding Tool Capabilities and Pitfalls
A critical consideration in this process is that chart rendering capabilities currently vary significantly across different software platforms and account tiers. While any major tool can assist with the preliminary planning and conceptual thinking stages, visual prototyping requires platforms capable of rendering actual chart images. Even with advanced tools, generating actual images instead of text-based approximations often requires multiple iterative prompts.
Recent testing indicates that platforms such as Microsoft Copilot and the free version of ChatGPT frequently struggle to render clear chart images for visual comparison, whereas the free tiers of Google Gemini and Anthropic Claude generally produce stronger results. Because these capabilities are evolving rapidly, user experiences will naturally shift as the underlying technology improves. Paid tiers across all major platforms generally yield the highest quality results, making them worthwhile for professionals with access. If advanced paid tiers are unavailable, the free version of Gemini currently serves as a reliable option, and professionals seeking to maximize their choices can copy and paste prompts across multiple platforms to generate a diverse set of approaches for evaluation and iteration.
Implementing the Process in Practice
To understand how this workflow operates in a real-world scenario, consider the role of a People Analytics Manager at a mid-sized consulting firm. The analytics team has recently concluded a comprehensive examination of the firm’s hybrid work policy, analyzing employee performance ratings, in-office attendance patterns, collaboration network data, and attrition trends. The synthesized research leads to a clear recommendation: transition away from the current blanket policy—which mandates three days in the office and two days remote for all employees—toward a differentiated approach tailored to specific roles and team types.
Following the initial context-setting and story-planning stages, the manager has established the overarching narrative arc, including specific takeaway titles for each planned slide. The focus now shifts to creating the actual visual content, beginning with two distinct graphs that support different points in the narrative. For the first graph—which illustrates how early-tenure attrition has increased since the implementation of the hybrid policy—Google Gemini was selected due to its superior output in free-tier testing. For the second graph—which demonstrates how the policy impacts different employee groups in opposite directions—ChatGPT Plus was utilized. Although a real-world project would typically maintain a single tool throughout, varying the platforms in this demonstration highlights how different systems handle complex visualization tasks.
Graph Attrition Rates by Role Type and Tenure
When prompting Gemini for the first visualization, the manager provided specific parameters regarding the audience, the core takeaway, and the intended use case. The audience was defined as a leadership team characterized by divided opinions and significant stakes in the outcome. The specific takeaway to communicate was that early-tenure attrition has spiked significantly since the hybrid work policy was enacted. The visualization was designed to function as a single graph within a larger live presentation, with the ultimate goal of persuading leadership to adopt a flexible, differentiated policy framework. A comprehensive data table summarizing pre- and post-policy attrition rates broken down by role type and tenure was provided alongside the prompt.
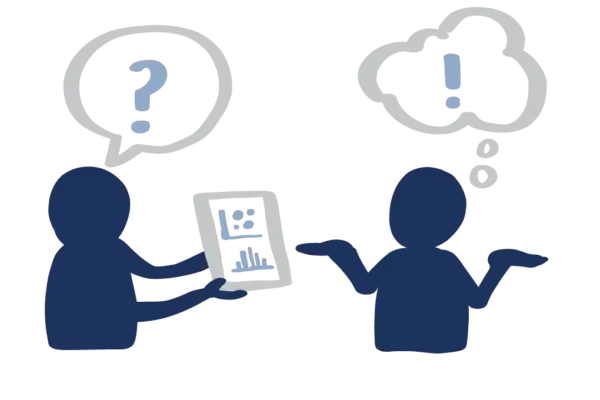
Before generating visual options, Gemini posed several clarifying questions to better orient its output. These inquiries explored the specifics of the proposed differentiated policy, the anticipated sources of pushback from leadership, and whether the decision-makers favored traditional graph formats or were open to less conventional visual approaches. Following these clarifications, the AI presented three distinct structural options: a slopegraph, a grouped bar chart, and a dumbbell graph. Furthermore, the system explained its color strategy, noting the intentional use of neutral gray to signify the pre-policy baseline alongside mid- and senior-tenure segments where no dramatic shifts occurred, contrasted with a bold red highlight applied exclusively to post-policy early-tenure attrition to draw immediate audience focus to the most critical finding.