Like many professionals navigating the modern workplace, data storyteller and design practitioners find themselves participating in an ongoing, real-world experiment with artificial intelligence. Almost every single day involves testing the boundaries of where automated tools genuinely help and where they ultimately get in the way. As these experiments continue to unfold across industries, a fundamental question keeps surfacing for professionals across the globe: when do we actually want to use artificial intelligence in our daily workflows?
There are certainly tedious parts of the data storytelling and visualization process that professionals genuinely enjoy, such as tinkering with visual alignment, adjusting color palettes, and sketching out raw ideas on paper before committing to a final digital layout. While these deliberate steps might occasionally feel inefficient or unnecessary to outside observers, they almost always serve as the catalyst for discovering new ideas and achieving a significantly better final output. By contrast, building every single chart from scratch or manipulating raw spreadsheet data to produce a non-standard visual rarely improves a designer’s critical thinking. This mechanical, labor-intensive phase is precisely what professionals are happy to hand off to automated systems, provided they do not lose granular control over the final design. Every minute saved from manually drawing and formatting charts is another minute that can be dedicated to analyzing the underlying story and refining the strategic narrative.

Rather than looking for artificial intelligence to completely redesign an entire slide autonomously, modern professionals are increasingly open to using it as a collaborative partner to generate a solid starting point that can be subsequently refined and polished. Recent tests of this collaborative approach within professional client projects are actively shifting how data designers approach their daily work.
One Chart That Is Doing Too Much
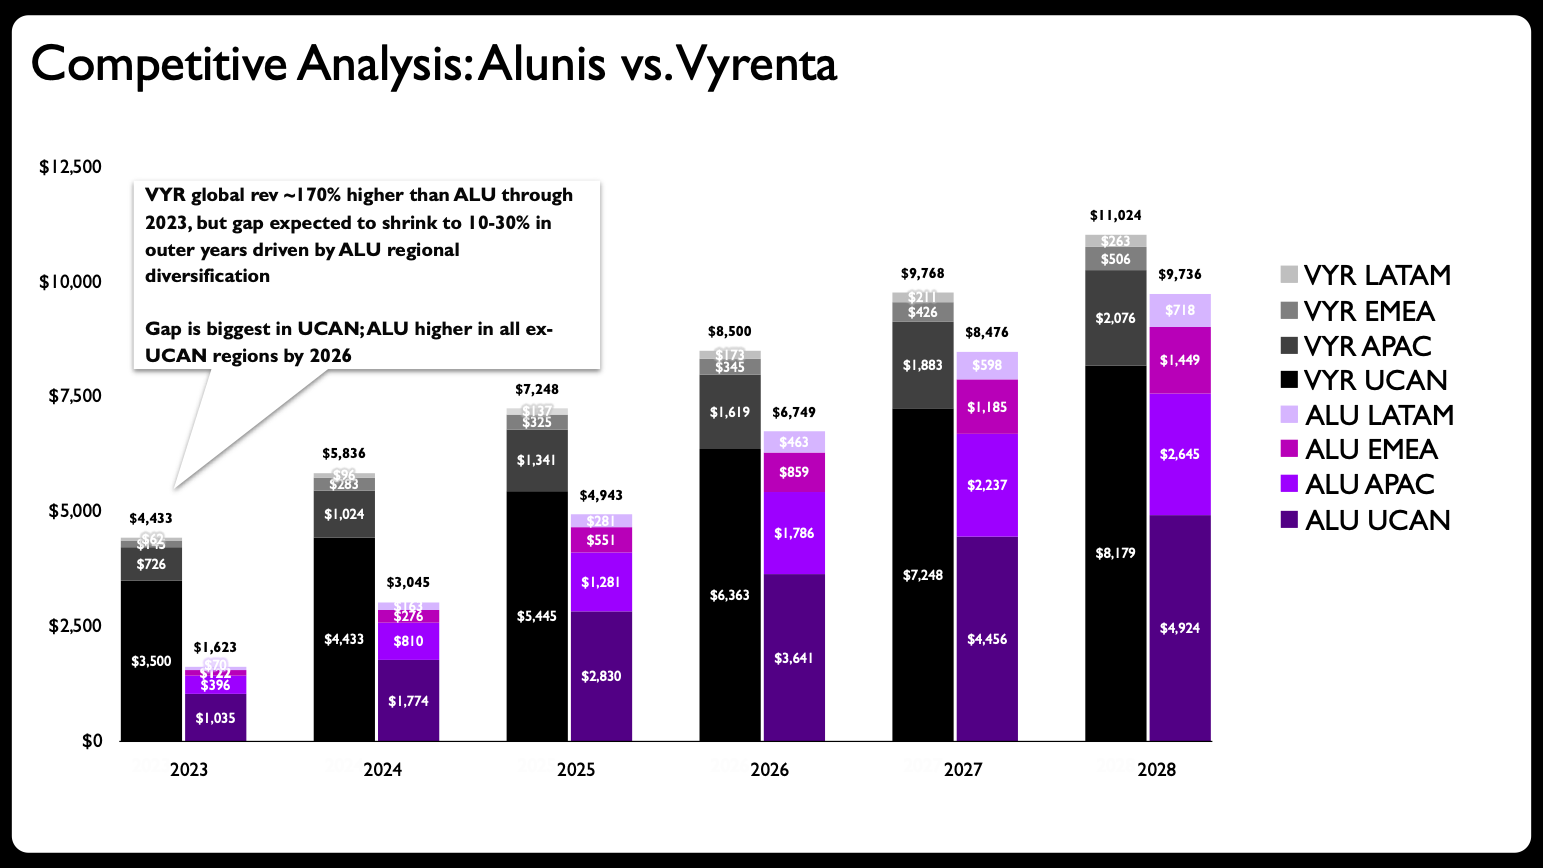
A recent client project provided the perfect testing ground to evaluate this human-AI partnership. The initial challenge centered on a complex slide containing a stacked bar chart designed to show how a growing company, Alunis, planned to close a substantial revenue gap with its top competitor, Vyrenta, by focusing strategically on regional expansion over time.
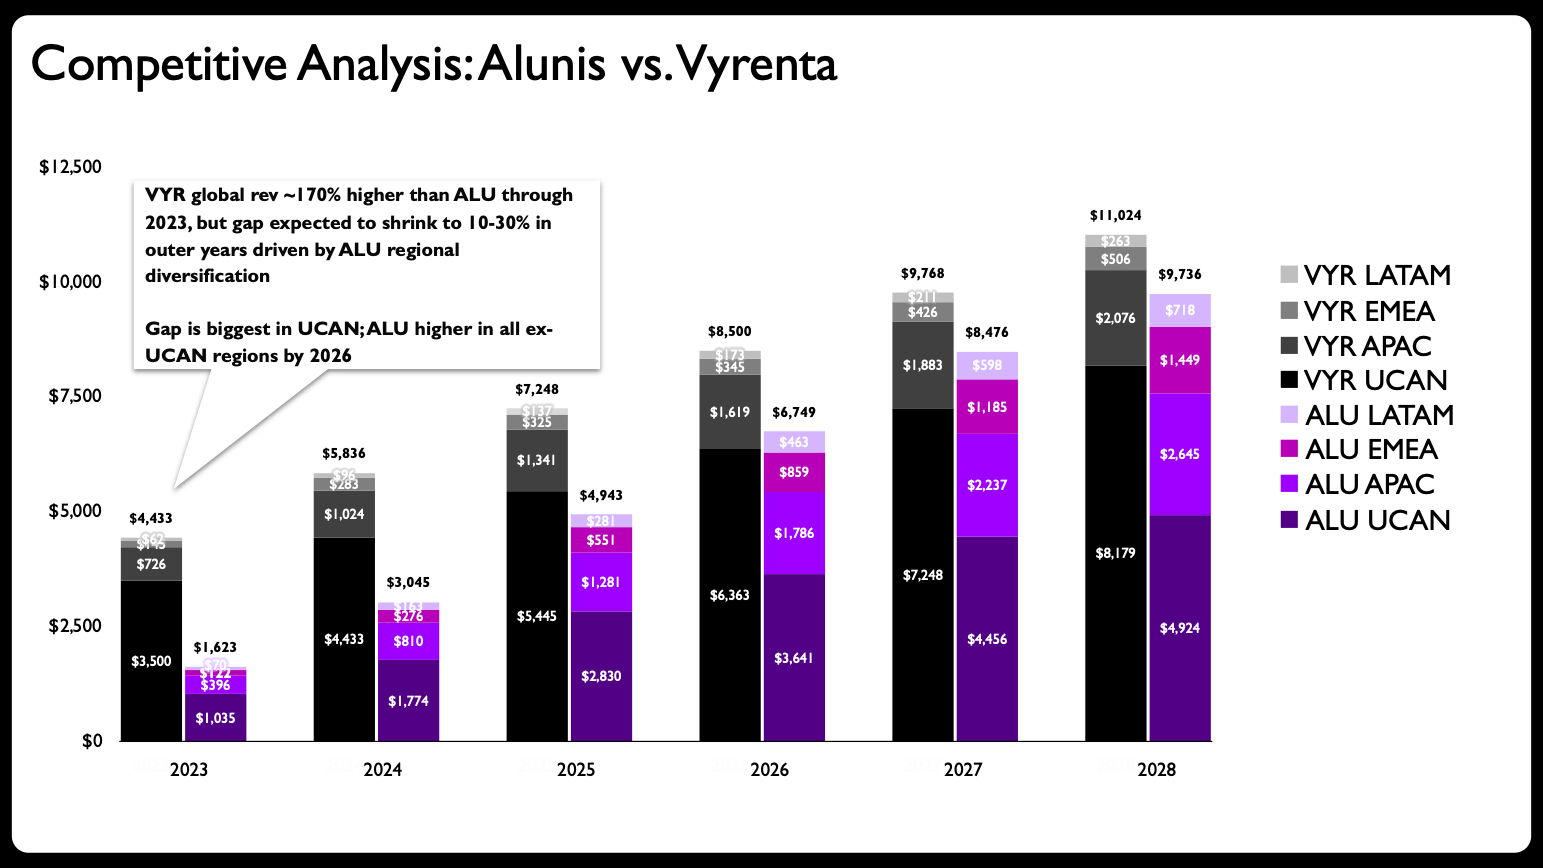
A preliminary evaluation of the graphic revealed a classic pitfall: the stacked bar chart was simply trying to do far too much heavy lifting all at once. The visual was tasked with communicating change over time, comparing the overall performance of two distinct corporate entities, and simultaneously breaking down each company’s regional composition. That represents an enormous amount of cognitive load for a single visual element to carry.
Data storytelling experts frequently point to common visualization mistakes, chief among them being the temptation to cram too much information into a single graph. The logical first step in any proper design makeover is to avoid this trap by decomposing the overly complex graph into multiple, digestible charts.
Partnering with Claude for Streamlined Redesign
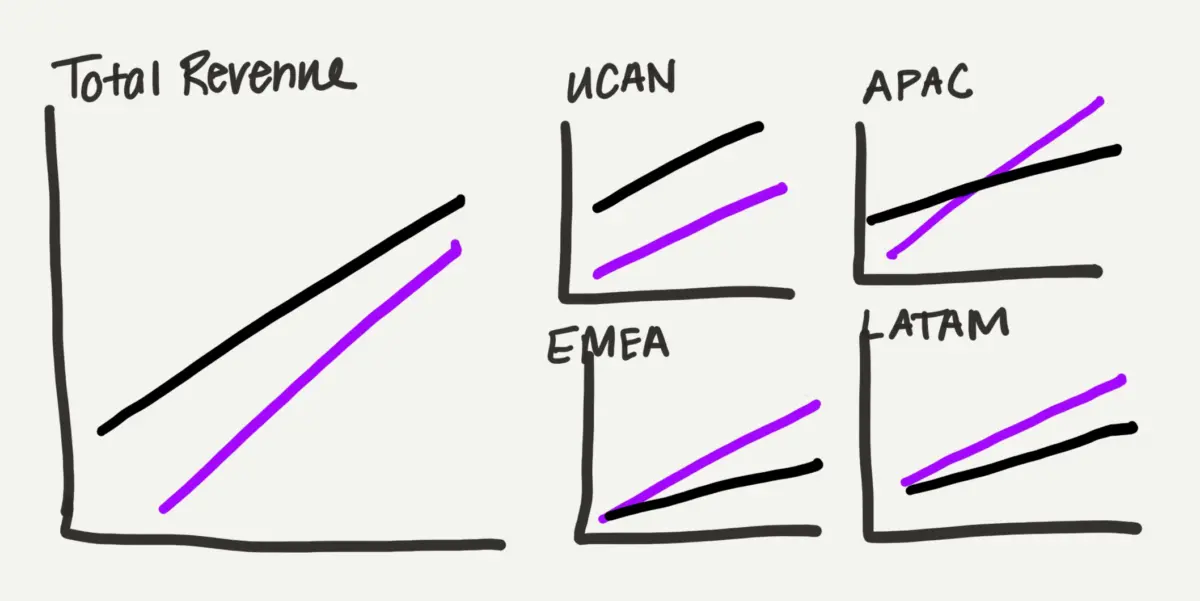
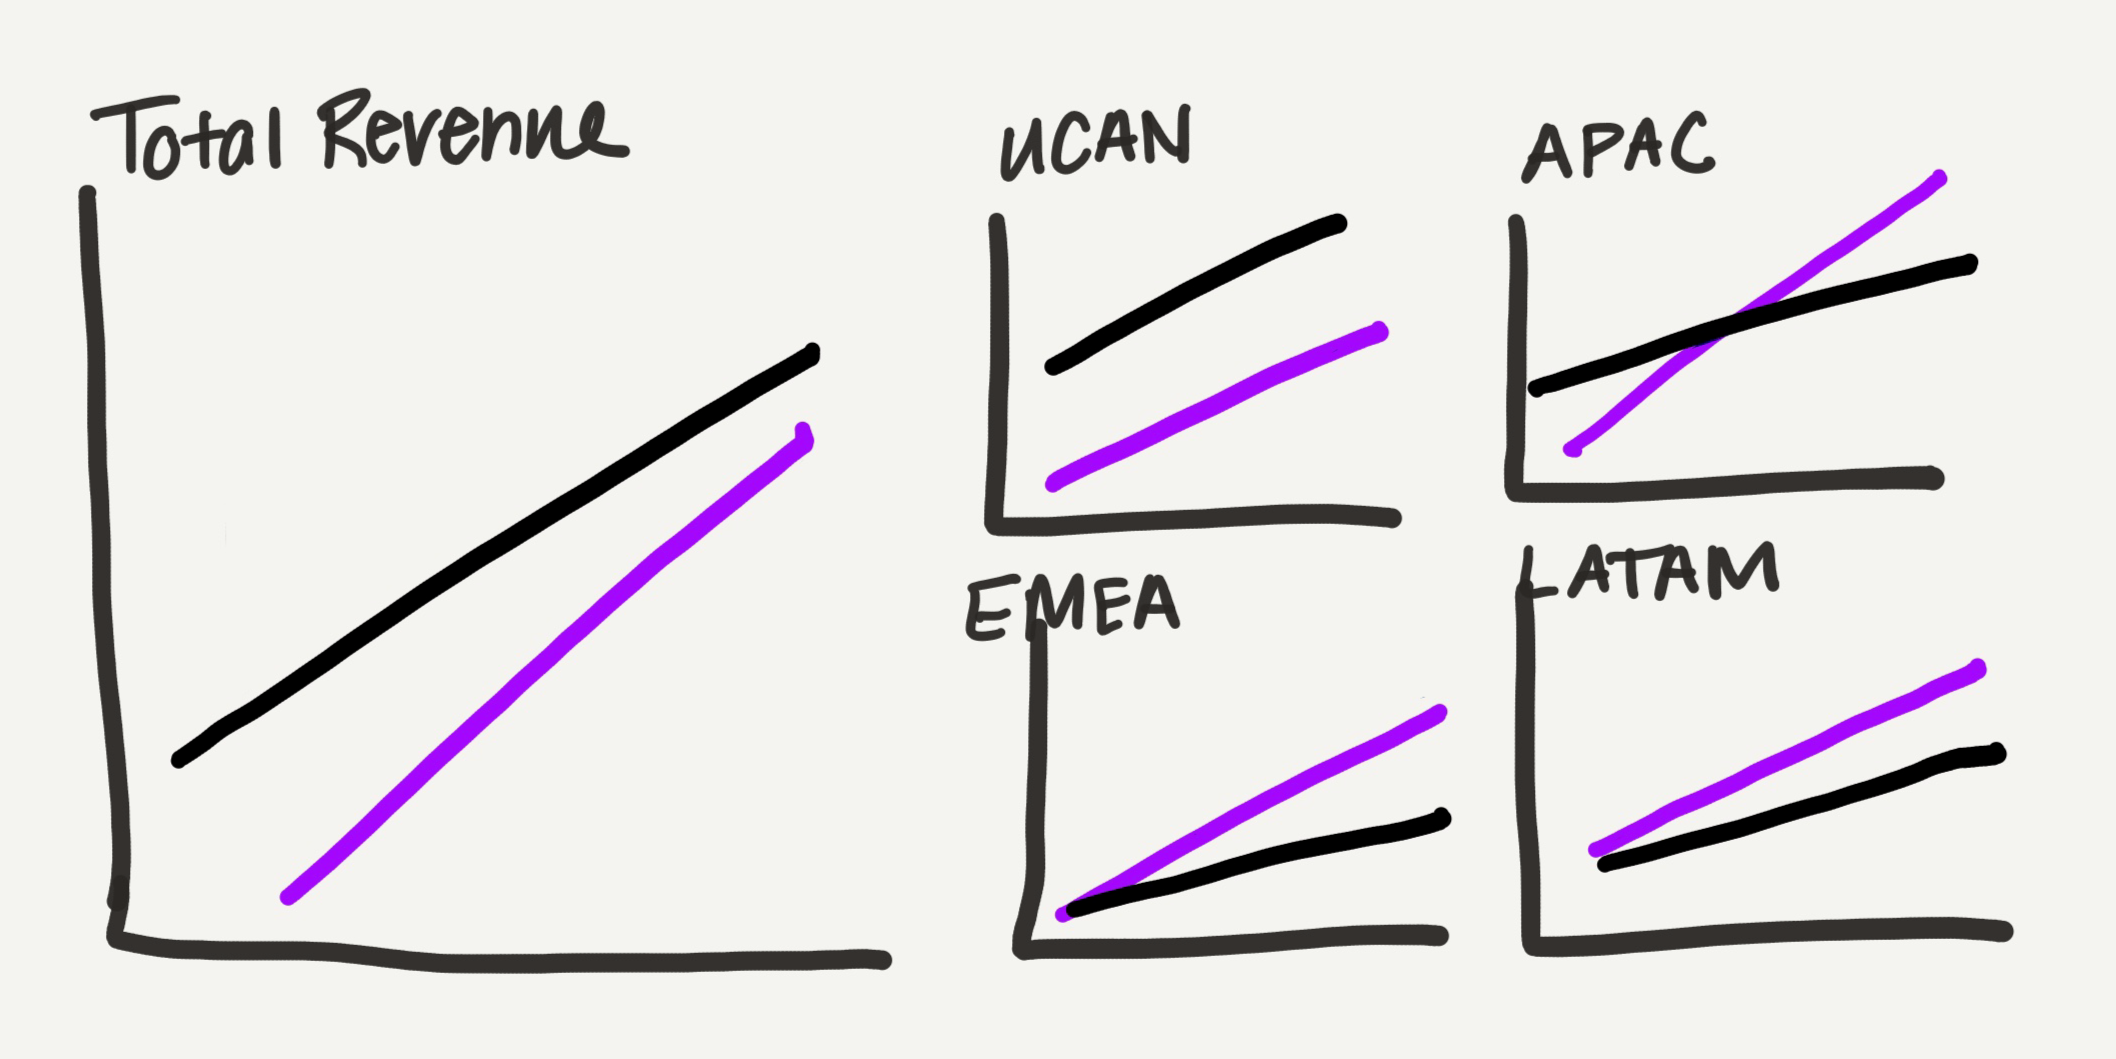
Because the iterative process often begins with physical sketching, the designer created a rough hand-drawn draft of how a multi-chart layout could look. Shifting away from traditional bars toward line charts offered a significantly lighter visual footprint—a major advantage for a crowded presentation slide carrying dense datasets.
The redesign strategy involved dividing the metrics by geographic location: dedicating one primary graph to total revenue and additional smaller graphs to each specific region. Rather than enforcing rigid, uniform sizing across all panels, the total revenue view was given prominence, while the four regional charts were organized into a compact grid occupying the same overall spatial footprint as the primary chart. This thoughtful arrangement provided a subtle, intuitive way to visualize the data’s inherent part-to-whole nature.
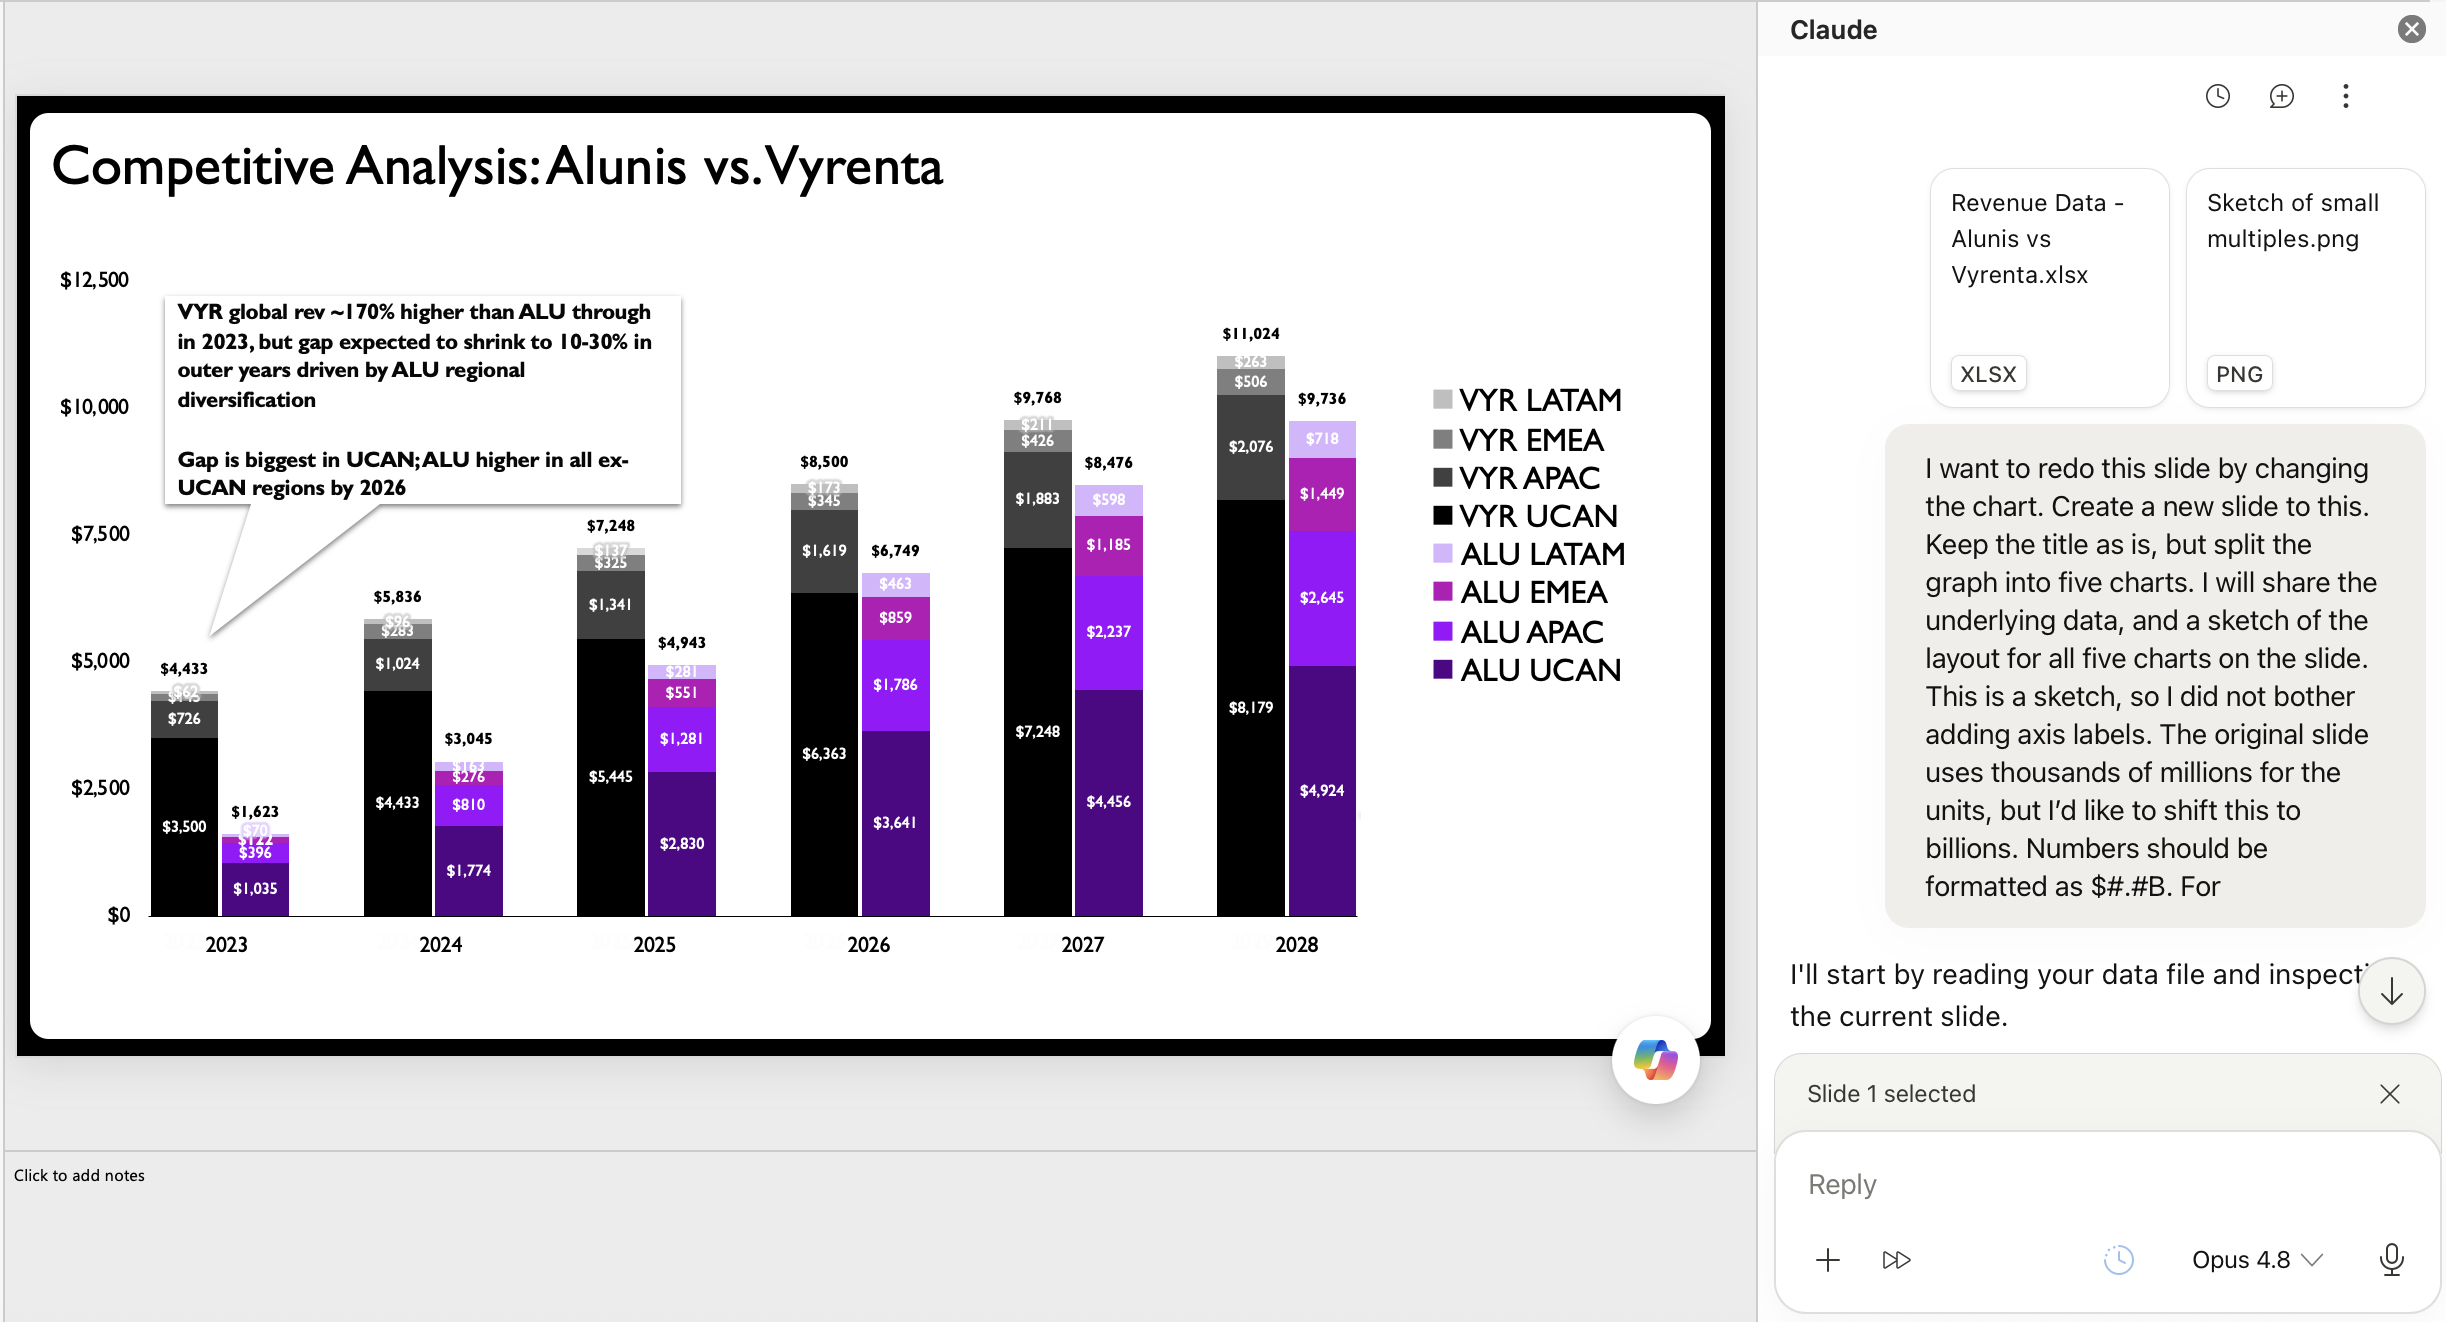
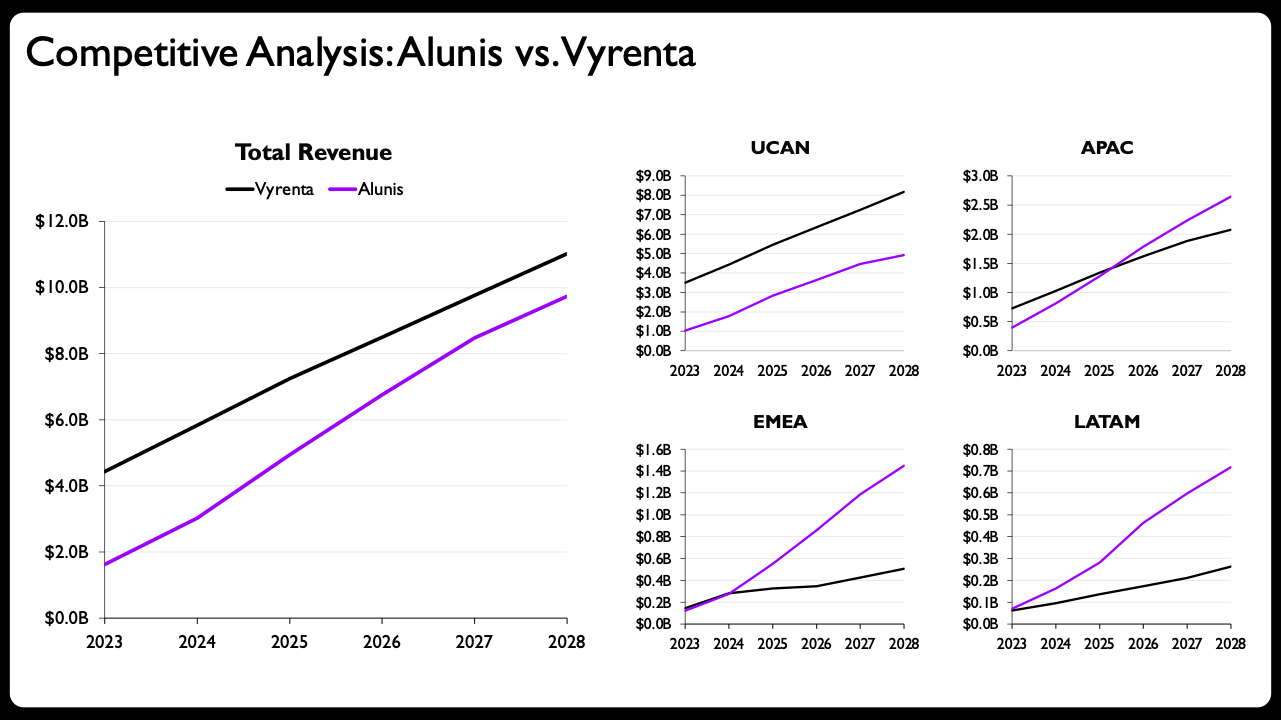
In a traditional pre-AI workflow, creating each of these individual graphs natively within presentation software would have demanded a considerable investment of time, patience, and mental energy. For this project, however, the designer shared the hand-drawn sketch and raw data directly with Claude, leveraging a Microsoft PowerPoint add-in that allows users to generate fully editable charts natively within presentation software.
While various generative tools offer charting capabilities with varying degrees of success, the ability to produce editable native slide elements is what makes this collaborative workflow truly viable. Similar capabilities exist across other major productivity ecosystems, proving that the methodology can be adapted to whichever software suite a professional prefers.
The Irreplaceable Value of Human Direction
The initial output generated by the AI assistant based on the rough sketch and data prompt represented a marked improvement over the original stacked bar chart. For many general practitioners, simply updating the slide title and adding brief descriptive text above the generated charts would have been more than enough to call the makeover complete.
However, elevating the design to a professional standard required several crucial human-led refinements. The first tier of enhancements included applying shaded visual areas directly between the two competing data lines to emphasize the narrowing revenue gap, and implementing clear end-of-line labels displaying exact values for immediate legibility. Additional refinements involved scaling the axis ranges independently to fit each specific region’s unique financial scale, utilizing solid versus dashed lines to clearly distinguish actual historical data from future projections, and streamlining the year formatting on the smaller panels.
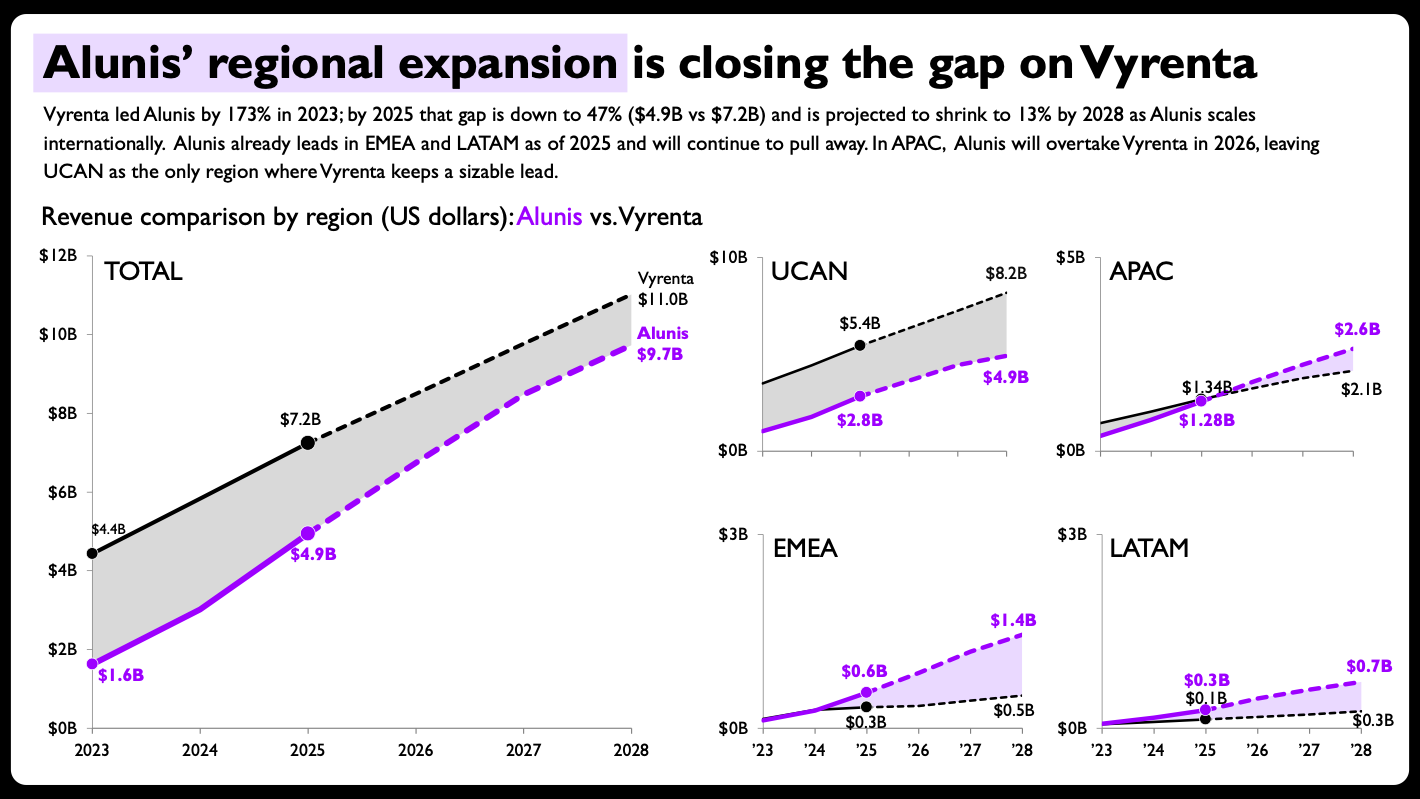
The resulting redesign showcased a remarkably effective partnership between human intuition and artificial intelligence. This seamless execution relies entirely on one vital factor: editable output. When AI-generated visuals are locked into static images with processing inaccuracies, designers waste precious time trying to correct automated errors. But when tools can generate clean, editable native charts, they finally become genuinely useful additions to an established professional workflow.
The broader implications of these developments extend far beyond experienced data visualization practitioners. For individuals who are new to data storytelling or uncertain about how to construct a particular chart type from scratch, artificial intelligence can effectively lower the initial learning curve.
At the same time, automation does not eliminate the fundamental need to understand the underlying principles that govern effective communication. Designing this specific makeover still required the foundational knowledge to recognize that a stacked bar chart was fundamentally flawed for the dataset, to orchestrate a clean layout for multiple panels on a single slide, and to determine whether breaking conventional axis-scaling rules served a deliberate strategic purpose.
Ultimately, the human professional remains firmly in the driver’s seat. Human practitioners provide the critical judgment and strategic direction, while artificial intelligence dramatically accelerates the mechanical execution. For modern data storytellers, that division of labor represents the most rewarding evolution of the craft to date.