The Pacific Northwest of the United States offers a dramatic landscape defined by rocky beaches, hidden waterways, uninhabited islands, and mountains stretching as far as the eye can see through the region’s characteristic seasonal fog. For outdoor enthusiasts living in Washington state, the summer weather provides an ideal window for hiking local mountain ranges, particularly routes that culminate in waterfalls. Washington serves as an exceptional home for such adventures, boasting over 2,900 waterfalls within its borders, including the tallest waterfall in the continental United States, Colonial Creek Falls.
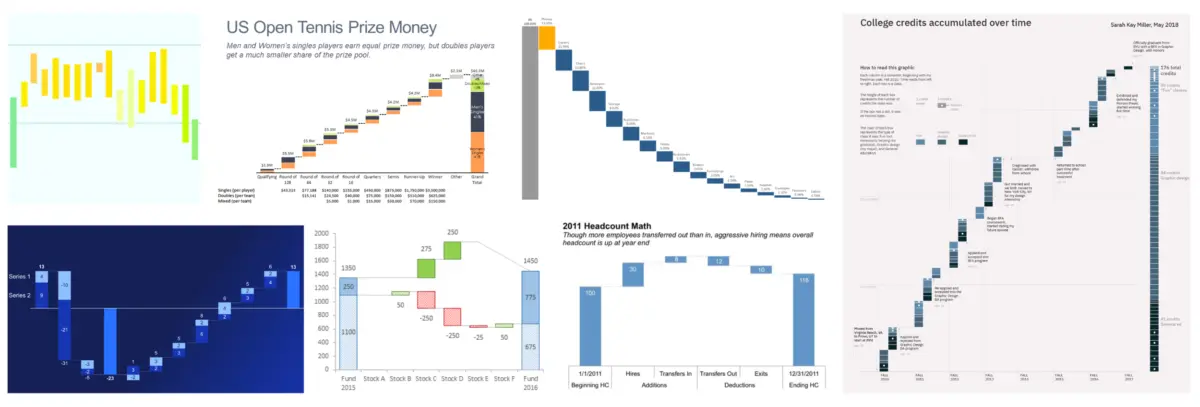
Immersed in this inspiring natural environment, a recent waterfall hike prompted a broader reflection on one of the most powerful and effective formats in visual data communication: the waterfall chart. These specialized charts serve as formidable tools for narrative-driven data storytelling because they clearly illustrate a sequential progression, mapping out an initial starting point, capturing every incremental change or adjustment along the way, and ultimately revealing the final ending value.
While the data community previously tackled waterfall charts during a challenge years ago, organizers have announced a fresh look at the format for the current monthly initiative. Practitioners have historically deployed waterfall charts for granular sales breakdowns or cause-of-change analyses. However, the utility of these visualizations extends far beyond standard financial reports. They work exceptionally well for tracking human resources headcounts, subscription growth and churn metrics, or even monitoring cumulative score changes over the course of a competitive sports match.
Waterfall charts offer unique structural advantages in professional communications. They are particularly effective during live walkthrough presentations, where a speaker can dedicate focused time to discussing critical intermediate bars in the middle section of the chart. Simultaneously, they provide valuable visual white-space in written communications and reports, allowing audiences to digest complex sequential movements without feeling overwhelmed by cluttered data points. To explore the diverse and creative ways professionals apply this visualization technique, the data community has officially made waterfall charts the focus of the new monthly challenge.
The Challenge Details
Participants are invited to share an original waterfall chart as part of the ongoing community challenge. Contributors have full flexibility regarding their data sources, choosing to use proprietary internal data, publicly available datasets, or simply practicing with classic examples provided by the organization. As a standard best practice for public data sharing, contributors must ensure they properly anonymize any sensitive information that cannot be publicly disclosed.
For community members who may be less familiar with the format, foundational resources on how to build a waterfall chart, alongside essential design considerations, have been made available through the related resources section. Whether participants choose to tackle a serious corporate analysis or explore a lighthearted, fun topic, the overarching goal remains telling whatever compelling story inspires them most.
Submissions for the waterfall chart challenge must be submitted through the official community portal by August 31 at 5:00 PM Pacific Time. Participants who are seeking specific feedback, critique, or technical input on their visualizations are encouraged to include those specific details and questions directly within their accompanying commentary to guide peer reviewers.
Related Resources
To support community members throughout the challenge, organizers have compiled a comprehensive selection of supplementary reference materials focused on building and refining effective waterfall charts. These resources provide foundational guidance on technical execution, layout principles, and visual best practices to ensure that every submitted chart communicates its sequential narrative with maximum clarity and impact.