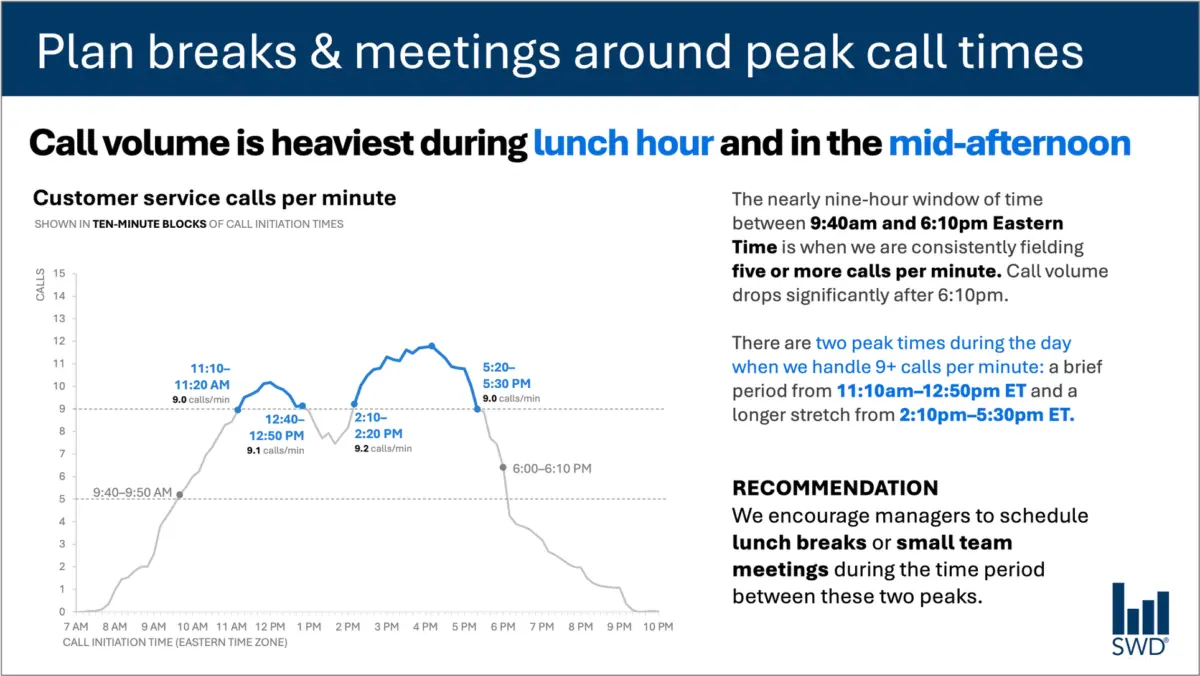
When professionals look at a graph depicting customer service call volume throughout a typical business day, the immediate visual pattern is usually straightforward. The data shows that call volume climbs steadily in the morning, remains high through much of the core workday, and hits notable peaks around lunch and again in the afternoon. On a purely descriptive level, the chart successfully visualizes the ebbs and flows of daily operational activity.
However, the primary audience for this specific data visualization is not viewing the graph out of idle curiosity regarding call patterns. The viewers are staffing managers, individuals whose daily responsibilities require them to make operational decisions based on workforce demand. The presentation of this information is predicated on the assumption that these managers can actively do something useful with the insights being shared.
This vital operational context changes everything about how the accompanying text must be chosen and structured. When communicating data to decision-makers, the surrounding words cannot merely describe what is already visible on the screen; they must bridge the gap between raw data and actionable strategy.
Consider the difference in impact when a chart is thoughtfully annotated for an operational audience. A prominent takeaway title reading "Plan breaks and meetings around peak call times" immediately signals to staffing managers what matters most in the data. Meanwhile, a descriptive graph title, such as "Customer service calls per minute," clearly orients the viewer to the exact metric they are examining. Precise annotations pinpoint the exact moments when call volume crosses critical thresholds, providing essential context about the nature of the two daily peaks. Finally, a clear recommendation translates the visual evidence into a tangible operational directive: scheduling lunch breaks and small team meetings specifically during the lulls between the peaks.
Every piece of text on a well-designed slide or report has a specific job to perform. This realization touches on a common misconception in professional communications. Organizations frequently talk about reducing word counts as though fewer words are inherently better in every context. Experience shows that this is simply not true. Stripping away all of the text surrounding a complex graph might make a slide look more minimalist, but it rarely makes the visualization more useful to a busy reader. The true objective of professional communication is not minimalism for its own sake, but rather the inclusion of the right words to ensure effective comprehension and action.
Different words do different jobs
When professionals are deciding which words belong on a graph, a presentation slide, or a formal report, they must first think critically about what their audience actually needs from those words to make informed decisions.
Different text elements serve distinct functions within a visual communication framework. A takeaway title can communicate the main business point or prompt a specific action. A descriptive graph title can quickly orient the audience to the underlying metric they are examining. Direct labels integrated into the visual can completely eliminate the tedious work of referring back and forth between the data points and a separate legend. Annotations can explain what happened, draw attention to critical anomalies, or add vital context that is not immediately evident from the raw data alone. Traditional elements like axis titles, footnotes, and source information can then provide additional granular detail when it is genuinely needed by stakeholders.
Not every graph or data visualization requires all of these textual components simultaneously. The overarching goal for communicators is to be deliberate and purposeful. Presenters must continually ask what their audience needs to accurately understand the information presented, what those viewers should know or do as a result of seeing the data, and where a few well-chosen words could eliminate confusion or make the core message unmistakable.
Once those questions are answered, the communicator can safely eliminate any extraneous words that are not actively helping the audience grasp the insight.
The insight has to come from somewhere
This careful balancing act highlights where the human role becomes especially critical, particularly in an era where professionals increasingly partner with artificial intelligence to draft presentations and reports.
Imagine feeding the customer service call-volume data into an AI tool and asking it to generate a slide. The system would likely succeed in identifying the underlying pattern. It might accurately report that call volume is highest around lunchtime and again in the mid-afternoon, and it could probably generate a polished, grammatically correct sentence describing that observation.
Yet, a polished description is not yet a true insight.
A genuinely useful recommendation can only come from combining raw data with additional layers of human context. Who is the actual audience for this presentation? Why are they looking at these specific numbers? What do they genuinely care about in their day-to-day roles? What operational decisions are actually within their control? Once a human expert establishes that the audience consists of staffing managers, the observed pattern transforms from a passive observation into actionable intelligence.
This fundamental concept remains central to modern data storytelling frameworks: professionals must provide AI tools with the necessary human context before asking them to assist with communication tasks. Artificial intelligence can certainly help find concise wording, suggest alternative titles, draft labels and annotations, and test different ways to articulate a complex idea. However, a human being must still understand the operational situation well enough to recognize what truly matters.
A polished sentence generated by software is never the same thing as a hard-earned human insight.
Professionals who have spent meaningful time working closely with organizational data possess institutional knowledge that technology simply cannot replicate. They know the historical background of the metrics. They know what operational changes occurred last quarter to alter customer behavior. They understand the broader organizational context and the specific pressures their audience cares about. An experienced manager may recognize immediately that one minor movement in a graph is historically consequential, while another movement that looks visually prominent on the page is entirely irrelevant noise.
Communicators must bring that deep background knowledge to their slides and reports. They must then use carefully chosen words to make their strategic thinking visible to stakeholders. The ultimate goal in professional reporting is never about maximizing or minimizing word counts; it is about finding the right words to do the right jobs.