In the modern workplace, data visualization is often treated as an exercise in aesthetic minimalism. Professionals are frequently advised to strip away visual clutter, delete extraneous elements, and let the numbers speak for themselves. Yet, a fundamental tension exists between simply displaying raw data and helping an audience extract practical value from it. Recent discussions within data storytelling circles have highlighted a critical realization: removing all contextual text from a chart or slide may create a clean minimalist design, but it rarely makes the communication more useful.
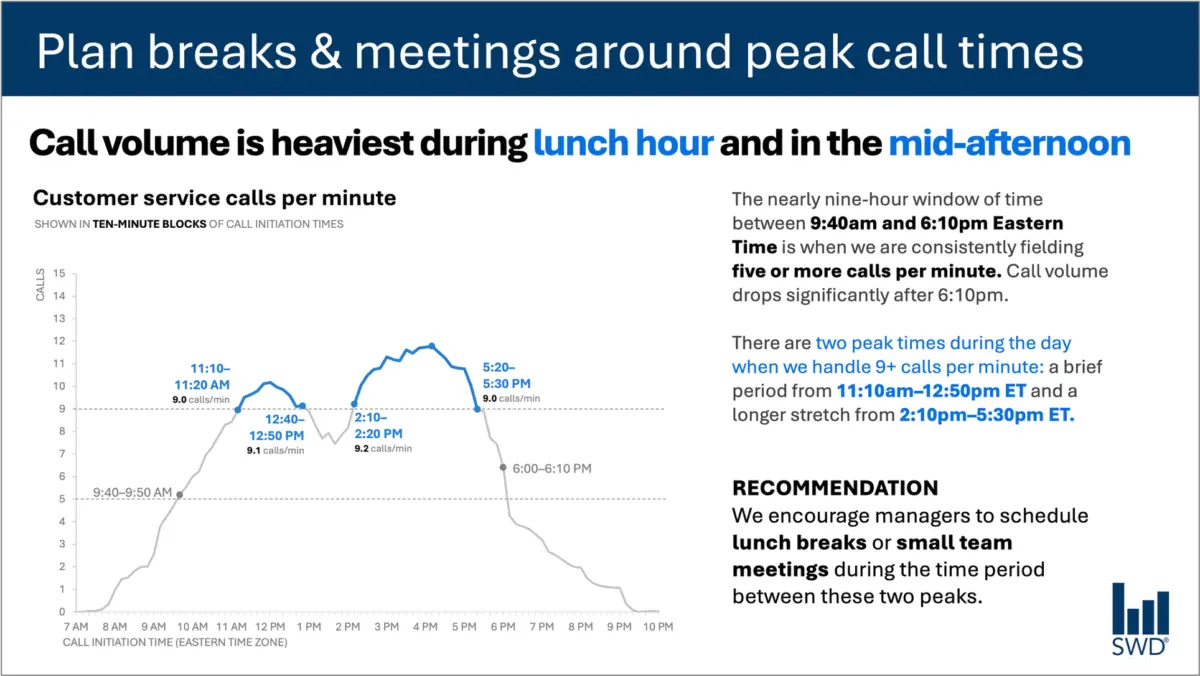
Consider a standard line graph mapping customer service call volume throughout a typical business day. Viewed in isolation, the chart reveals a predictable operational pattern. Call volumes begin to climb steadily in the morning hours, remain consistently high through the core of the workday, and form distinct peaks around the lunch hour and again in the mid-afternoon.
On its own, this visualization is merely descriptive. However, the nature of the communication changes fundamentally when considering who is actually looking at the graph. If the audience consists of staffing managers, they are not examining the chart out of casual curiosity. They are operational leaders who need to make real-world decisions regarding scheduling, workforce allocation, and break management. Displaying the chart to them implies that they can, and should, take action based on what they see.
This shift in audience context dictates every textual choice a communicator makes. Instead of relying on a vague label or leaving the audience to decode the implications themselves, effective data storytelling integrates targeted text elements, each performing a specific, deliberate job.
A well-constructed slide or data visualization utilizes different categories of text to serve distinct communicative functions. A primary takeaway title can directly communicate the main point or required action. For instance, framing the graph with a title like "Plan breaks and meetings around peak call times" immediately signals to staffing managers what matters most. Meanwhile, a descriptive graph title, such as "Customer service calls per minute," grounds the audience and clearly establishes what data they are looking at.
Furthermore, strategic annotations can pinpoint the precise moments when call volume crosses critical operational thresholds, adding vital context about the nature of the two daily peaks. Finally, a clear recommendation translates the visual evidence into a concrete course of action, such as scheduling lunch breaks or small team meetings exclusively during the lulls between the peaks.
This approach challenges the persistent misconception that reducing the volume of words on a presentation slide is always an inherent improvement. While brevity is valuable, eliminating the narrative and contextual framing around data often strips away the very elements that make the information actionable. The objective is not to maximize or minimize the word count arbitrarily, but rather to deploy the right words to ensure effective communication.
Different Words Do Different Jobs
When deciding which textual elements belong on a graph, a slide, or an analytical dashboard, creators must first evaluate what their specific audience requires to fully comprehend the information. Every piece of text included in a visual display should carry its own weight and serve a defined purpose.
A takeaway title should articulate the core takeaway or the recommended action. A descriptive graph title should orient viewers so they immediately understand the metric and scope of what they are observing. Direct labels can be employed to eliminate the cognitive friction of forcing an audience to constantly glance back and forth between the data points and a distant legend. Annotations serve to explain historical context, highlight anomalous events, or draw immediate attention to crucial thresholds that might not be immediately obvious from the geometric shape of a trendline alone. Traditional elements like axis titles, footnotes, and data source citations provide necessary auxiliary detail when deeper scrutiny is required.
Crucially, not every chart or data visualization requires every single one of these components. The underlying goal is intentionality. Communicators must continually ask what their audience needs to understand the material, what they should know or do as a direct result of seeing the presentation, and where a few carefully chosen words could eliminate confusion or make the central insight unmistakable. Once those questions are answered, any extraneous text that fails to advance the audience’s understanding should be stripped away.
The Insight Has to Come from Somewhere
This delicate balance between data presentation and strategic context brings to light the vital role of human expertise, particularly as organizations increasingly experiment with artificial intelligence in their daily workflows.
Imagine prompting an artificial intelligence tool with the same customer service call-volume dataset and asking it to generate a presentation slide. An advanced AI model is fully capable of analyzing the numbers, recognizing the underlying pattern, and noting that call volume surges around lunchtime and during the mid-afternoon. It could readily synthesize this observation into a polished, grammatically correct sentence.
However, a polished descriptive sentence is not the same thing as a true operational insight.
The transition from a basic data observation to a useful, actionable recommendation requires external context that raw numbers alone cannot supply. It requires understanding who the audience is, why they are looking at the data, what specific outcomes they care about, and what operational levers are actually within their control. Once it is established that the audience is composed of staffing managers with the authority to adjust shift schedules, a descriptive pattern transforms into a springboard for action.
This principle forms the cornerstone of modern data communication strategies, such as the SWD and AI Primer framework, which emphasizes the necessity of providing AI with comprehensive context before asking it to assist with communication tasks. Artificial intelligence can undeniably aid professionals in finding concise phrasing, suggesting potential titles, drafting data labels, and testing various ways to articulate a complex idea. Yet, a human operator must still understand the underlying business situation well enough to recognize what truly matters.
Professionals who have spent considerable time working directly with their data possess an intimate familiarity that automated tools simply cannot replicate. They know the institutional history, understand what operational changes occurred last quarter, and grasp the broader organizational environment. They are uniquely positioned to recognize that one specific movement on a graph is deeply consequential due to external market factors, while another movement that appears equally prominent visually is merely a routine fluctuation.
By bringing this distinct human knowledge to the visualization process, creators can use words to make their underlying analytical thinking visible to others. Ultimately, effective visual communication is defined neither by an arbitrary abundance of text nor by radical minimalism, but by the deliberate deployment of the right words performing the right jobs to drive meaningful action.