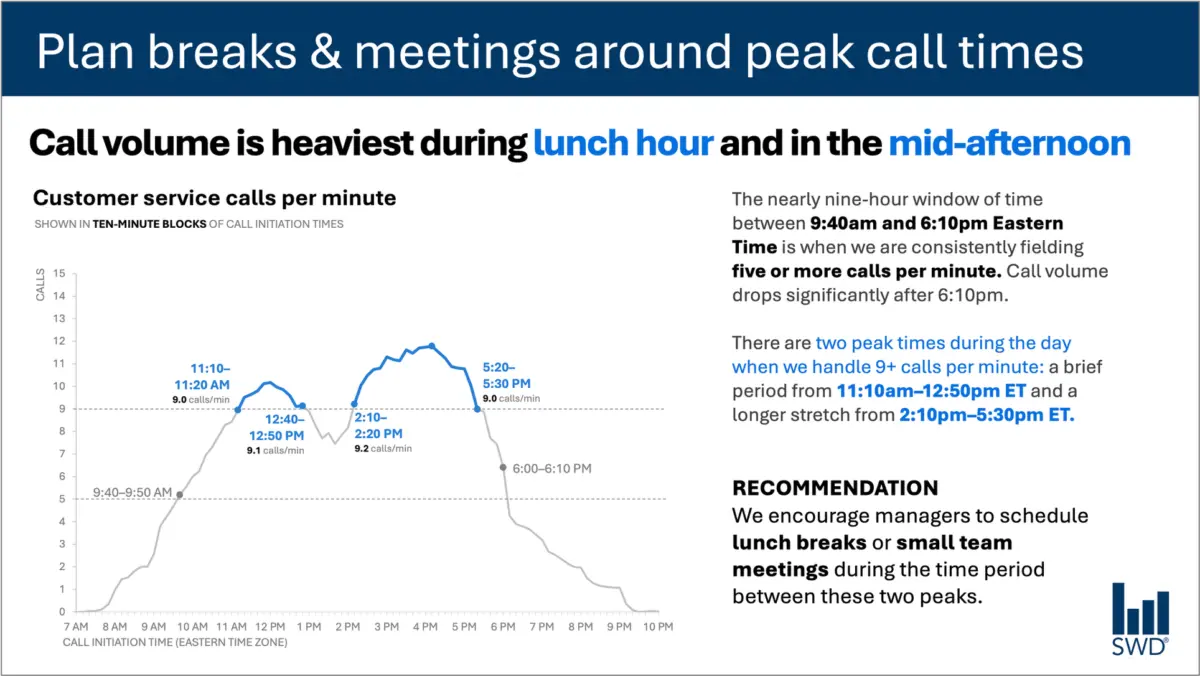
When professionals look at a graph depicting customer service call volume throughout a typical business day, the raw pattern is usually clear enough at first glance. Data visualization reveals that inbound calls begin to climb steadily in the morning hours, remain consistently high through much of the core workday, and ultimately reach distinct peaks around the lunch hour and again in the mid-afternoon.
Viewed in a vacuum, such a visualization is merely a reflection of operational rhythms. But when presented to a specific audience—such as staffing managers responsible for scheduling and workforce deployment—the nature of the data changes entirely. The audience is not reviewing the graph out of idle curiosity regarding customer behavior; they are looking at it because they are in a position to take action, optimize resources, and influence operational efficiency.
This vital shift in perspective dictates how communication must be constructed. Recognizing the audience’s intent changes the entire approach to choosing words, structuring slides, and translating cold metrics into meaningful operational strategy.
Consider how language bridges the gap between raw data and actionable insight. A strategic takeaway title, phrased directly as an instruction like "Plan breaks & meetings around peak call times," immediately communicates to staffing managers what matters most in the data. Meanwhile, a precise descriptive graph title—such as "Customer service calls per minute"—informs them objectively about what they are observing. Strategic annotations pinpoint the exact moments when call volume crosses critical operational thresholds, providing essential context about the two distinct peak periods. Finally, a clear recommendation translates all of this analytical evidence into a concrete action: scheduling lunch breaks or small team meetings exclusively during the lulls between the peaks.
Every element of text deployed in this scenario serves a distinct, purposeful job. This realization sits at the heart of modern data storytelling. In professional settings, communicators sometimes fall into the trap of treating brevity as an absolute virtue, operating as though fewer words are inherently better. Experience shows that this is rarely the case. Stripping away all the surrounding text from a data visualization might yield a superficially minimalist slide, but it rarely results in a more useful one. Effective communication requires adding the right words in the right places to ensure the message is understood and acted upon.
Different words do different jobs
When professionals evaluate which words belong on a graph, a dashboard, or a presentation slide, the decision-making process must begin by identifying what the audience actually needs to successfully interpret and utilize the information. Different textual components play specialized roles in guiding the viewer’s eye and understanding.
A takeaway title communicates the core message or the primary action required, shifting the focus from mere observation to strategic execution. A descriptive graph title anchors the audience, orienting them to the specific parameters of what they are viewing. Direct labels eliminate the cognitive friction of repeatedly shifting one’s gaze back and forth between the primary data visualization and a remote legend. Annotations go a step further by explaining underlying events, drawing immediate attention to critical inflection points, or adding contextual depth that cannot be derived from the numbers alone. Meanwhile, supporting elements like axis titles, footnotes, and source information provide secondary details whenever deeper verification is required.
Crucially, not every graph requires every single one of these textual layers. The ultimate objective is deliberate design. Communicators must continuously ask what their audience needs to fully comprehend a visualization, what they should know or do as a direct result of seeing it, and where a few well-chosen words can eliminate ambiguity and make the core message unmistakable.
Once those elements are established, the remaining clutter—words that do not actively contribute to understanding—can be safely discarded.
The insight has to come from somewhere
This nuanced challenge highlights why the human role remains indispensable, particularly in an era where professionals increasingly partner with artificial intelligence to draft presentations and analyze datasets.
Imagine feeding complex call-volume data into an AI tool and prompting it to generate a polished slide. Advanced algorithms can readily identify the overarching pattern. The technology might quickly determine that call volume peaks around lunchtime and during the mid-afternoon, and it could effortlessly generate a grammatically flawless, highly professional sentence describing that observation.
However, a polished description is not yet an insight.
A truly useful recommendation only emerges when raw data is synthesized with broader organizational context. Questions such as who the audience is, why they are reviewing the information, what they genuinely care about, and which decisions fall within their direct control are entirely outside the scope of raw numbers. Once an analyst recognizes that the audience consists of staffing managers, a standard statistical pattern transforms into an actionable operational directive.
This principle forms the foundation of contemporary data communication frameworks, emphasizing that artificial intelligence must be supplied with deep contextual awareness before it is asked to assist with communication tasks. AI remains exceptionally powerful for finding concise phrasing, suggesting alternative titles, drafting labels and annotations, and testing different ways to articulate a complex idea. Yet, a human professional must still understand the operational reality well enough to recognize what truly matters.
A polished sentence and a genuine insight are fundamentally different things. Professionals who have spent extended time working directly with a dataset possess a wealth of tacit knowledge that AI simply cannot replicate. They know the historical background of the organization, they understand what operational changes occurred in the recent past, and they grasp the subtle organizational nuances that dictate audience priorities. A human expert may immediately recognize that one minor fluctuation in a graph is an early warning sign of a major systemic issue, while another seemingly prominent movement is merely a seasonal artifact of little consequence.
Bringing that comprehensive institutional knowledge to the design of a slide is what separates mediocre presentations from exceptional ones. The ultimate goal in modern data communication is never about maximizing or minimizing word counts. Success lies entirely in employing the right words to do the right jobs, making complex analytical thinking visible, transparent, and actionable for the people who need it most.