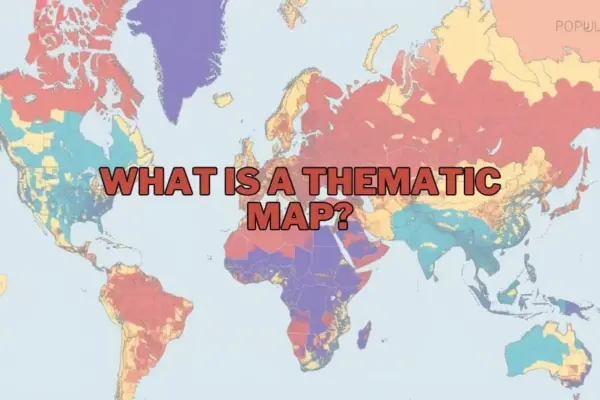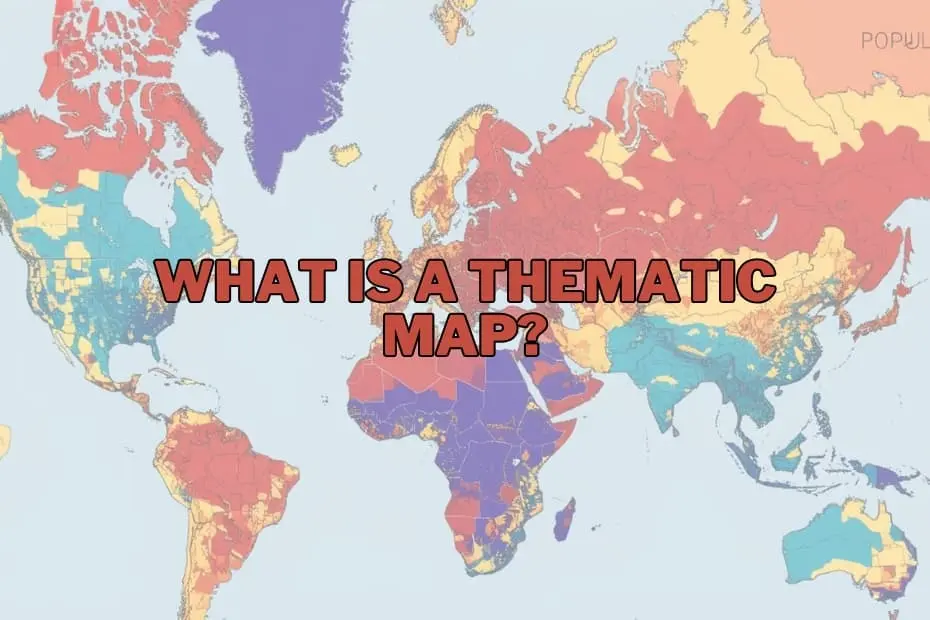
In an era increasingly defined by vast quantities of spatial information, maps have evolved far beyond basic tools designed merely for point-to-point navigation. Within the fields of geography, cartography, and visual data analytics, thematic maps have emerged as essential instruments for contextualizing complex datasets, uncovering hidden spatial patterns, and delivering data-driven narrative insights.
Unlike traditional general reference maps, which prioritize physical and political infrastructure like highways, topographies, state boundaries, and major cities, thematic maps concentrate on specific analytical subjects. These subjects range from regional climate variations and population densities to localized economic trends and public health metrics. By translating raw quantitative and qualitative data into visual distributions across geographic space, thematic mapping allows researchers, urban planners, public health officials, and corporate analysts to transform abstract figures into clear, actionable spatial intelligence.
The Strategic Purpose and Importance of Thematic Cartography
At its fundamental core, thematic mapping serves to bridge the gap between complex statistical data and spatial understanding. When dealing with broad environmental or social phenomena—such as the regional impacts of climate change on agricultural yields or the socio-economic effects of urban population growth—tabular data often obscures localized trends and spatial anomalies. Thematic maps solve this challenge by applying visual variables, including color gradients, proportional geometric symbols, and variable shading, across defined geographic areas.
This visual transformation renders complex geographical relationships immediately recognizable. A public official evaluating regional unemployment, for example, can immediately identify economic distress zones that require targeted fiscal intervention. Similarly, environmental scientists tracking precipitation variances can map rainfall patterns across diverse topographic zones to predict drought susceptibility or flooding risks. By simplifying complex spatial phenomena without stripping away essential context, thematic maps empower decision-makers across government agencies, commercial organizations, and academic institutions to make informed, evidence-based policy and operational choices.
Structural Typologies: Selecting the Right Map for Spatial Datasets
The analytical effectiveness of a thematic map depends heavily on matching the appropriate cartographic technique to the specific structure of the underlying data. Cartographers categorize data primarily into continuous phenomena, which change seamlessly across space, and discrete or aggregated categorical data, which align with specific administrative boundaries or precise locations.
For aggregated regional metrics—such as demographic density, average household income, or election results bounded by municipal or state lines—choropleth maps serve as standard visualization tools. Choropleth mapping applies distinct color fills or shading intensities to pre-defined geographic areas, directly linking visual color values to underlying statistical magnitudes. However, when mapping continuous physical phenomena like atmospheric pressure, land elevation, or annual precipitation, isoline or isopleth maps are utilized. Isoline maps rely on continuous lines connecting points of equal quantitative value, creating a smooth visual representation of gradient shifts across a landscape.
Other specialized mapping formats include proportional symbol maps, which scale geometric shapes according to data magnitude at specific points, and dot density maps, where individual dots represent a set quantity of a given phenomenon across a region. Choosing between these structural approaches requires careful evaluation of whether the subject matter is discrete or continuous, ensuring that the final visual representation accurately reflects real-world spatial conditions.
Fundamental Architectural Elements of Effective Map Design
Constructing a precise and readable thematic map requires meticulous attention to visual cartographic design standards. Every effective thematic map relies on a set of core structural elements that ensure accurate interpretation and prevent spatial miscommunication.
The map title provides immediate contextual focus, clearly defining the variable being analyzed, the geographic region under examination, and the temporal scope of the data. Surrounding the central graphic, a carefully structured map legend serves as the primary decoding key, defining the precise statistical ranges represented by various colors, symbols, or shading densities.
Furthermore, proper spatial orientation relies on scale indicators and spatial projection choices, which account for the geometric distortions inherent in translating a three-dimensional planet onto a two-dimensional surface. Accurate data source attributions ensure transparency, enabling readers to verify the underlying information, while clean visual hierarchy ensures that key analytical insights remain prominently highlighted without overwhelming the viewer with unnecessary cartographic clutter.
Cross-Disciplinary Applications in Public and Private Domains
The versatility of thematic cartography has made it indispensable across a vast spectrum of professional fields. In environmental science, thematic maps are deployed to monitor land-use transformations, evaluate ecosystem degradation, and track shifting climate zones over time. Scientists analyzing climate change, for instance, utilize thematic visual maps to illustrate temperature anomalies, melting ice sheet boundaries, and shifts in agricultural productivity zones.
In public health, spatial visualization plays a critical role in epidemiological tracking, outbreak management, and healthcare infrastructure allocation. By plotting disease incidence alongside demographic and environmental indicators, healthcare authorities can trace disease movement, identify vulnerable populations, and deploy medical resources efficiently.
Meanwhile, in the realm of urban planning and public administration, thematic maps guide infrastructure developments, municipal zoning, and emergency response strategies. City managers visualize population growth vectors to determine where new schools, transit corridors, or emergency facilities are most urgently required. Commercial enterprises and market analysts similarly rely on thematic maps to assess consumer demographics, evaluate competitor density, and determine optimal locations for retail expansion based on local socio-economic dynamics.
Critical Assessment: Practical Advantages and Inherent Constraints
While thematic maps offer unmatched analytical clarity, a rigorous evaluation requires understanding both their operational advantages and their inherent cartographic limitations. Among their primary benefits is the ability to condense dense statistical arrays into intuitive, visual formats. Complex multivariate patterns that might require extensive statistical analysis to detect in spreadsheets become immediately obvious on a well-designed thematic map, facilitating rapid pattern recognition and communication with non-technical stakeholders.
However, thematic cartography also presents notable technical challenges and risks of distortion. Aggregating data into pre-defined spatial units—such as zip codes, counties, or states—can introduce boundary artifacts, masking localized variations within a single polygon. This challenge, known in spatial analysis as the modifiable areal unit problem, can misrepresent localized realities if readers assume uniform distribution across an entire administrative region.
Additionally, visual misinterpretations can occur if color scales are poorly calibrated or if an inappropriate map format is applied to a given data type—such as using choropleth shading for continuous natural phenomena. Cartographers must therefore balance graphic simplification with analytical precision to ensure maps inform rather than mislead.
Technological Ecosystem: Tools and Software for Spatial Mapping
The modern landscape of spatial visualization has been fundamentally transformed by modern digital cartography software and Geographic Information Systems (GIS). These technological tools have democratized the map-making process, allowing both professional cartographers and novice analysts to turn raw datasets into high-impact thematic visualizations.
Leading open-source platforms like QGIS provide robust, accessible environments for spatial analysis, rendering, and custom map design without prohibitive licensing costs. For enterprise applications, advanced software suites such as ArcGIS offer comprehensive spatial analytical toolsets, complex geoprocessing workflows, and high-precision mapping controls suitable for large-scale urban and environmental studies.
Simultaneously, commercial business intelligence platforms like Tableau have embedded thematic spatial mapping capabilities directly into visual analytics dashboards. This allows corporate analysts to blend geographic data seamlessly with operational metrics. Online web-mapping libraries and cloud-based spatial platforms further expand accessibility, enabling interactive, web-based thematic maps that can be published and updated dynamically in real time.
Frequently Asked Questions Regarding Thematic Mapping
What is the fundamental difference between a thematic map and a reference map?
The primary distinction lies in their core visual and analytical focus. A reference map is designed to depict physical, administrative, and navigational features—such as roads, rivers, political boundaries, and populated places—without emphasizing any single variable. In contrast, a thematic map centers specifically on depicting a single dataset or subject theme across a geographical space, using background reference geography merely as a spatial context framework.
Can thematic maps be effectively utilized for historical data analysis?
Yes, thematic mapping is an exceptional tool for temporal and historical research. By mapping historical datasets—such as past census counts, historical disease outbreaks, or shifting territorial boundaries—researchers can visually trace geographic transformations over time. Comparing sequential thematic maps across different historical periods offers valuable visual evidence of demographic migrations, economic transitions, and environmental evolution.
What software solutions are recommended for beginners entering thematic map creation?
For beginners seeking to build thematic maps, open-source Geographic Information System tools like QGIS offer a rich feature set paired with extensive community documentation. Additionally, modern data visualization software like Tableau provides intuitive drag-and-drop interfaces for spatial mapping, making it ideal for users transitioning from standard spreadsheet analytics into spatial data visualization without requiring extensive programming experience.
How should analysts determine the appropriate thematic map type for their dataset?
Selecting the correct mapping format depends fundamentally on whether the underlying data represents continuous phenomena or aggregated discrete categories. Continuous data, such as temperature gradients or elevation changes, is best communicated using isoline maps. Conversely, discrete data grouped into pre-existing administrative boundaries, such as county-level household income or state population density, is far better suited to choropleth or proportional symbol mapping approaches.
Are thematic maps restricted exclusively to the discipline of geography?
No, thematic mapping extends far beyond traditional physical and human geography. Today, thematic maps are vital tools across business intelligence, epidemiology, environmental policymaking, economics, sociology, and urban administration. Any field that records data with a spatial component can leverage thematic maps to reveal patterns, optimize resource allocation, and enhance data-driven storytelling.