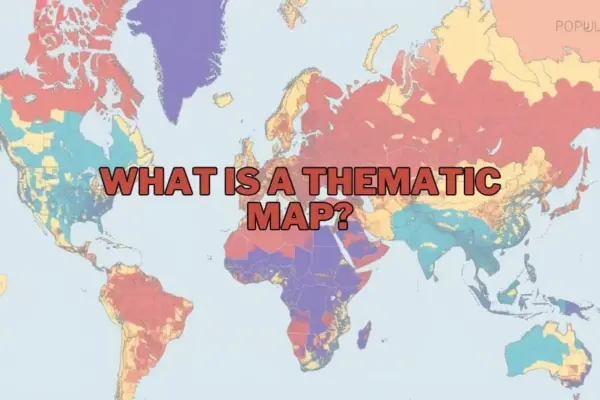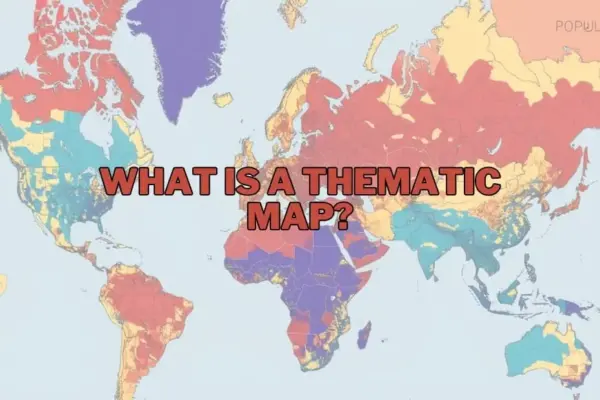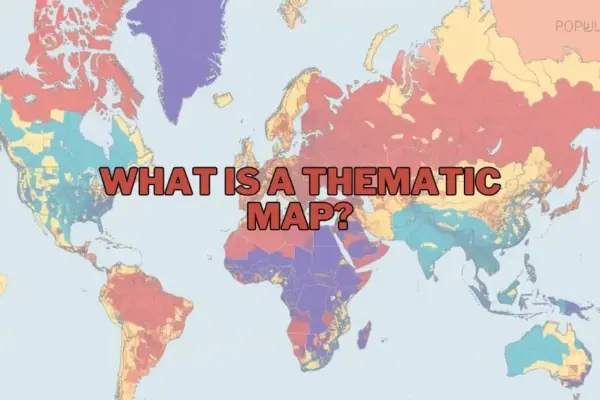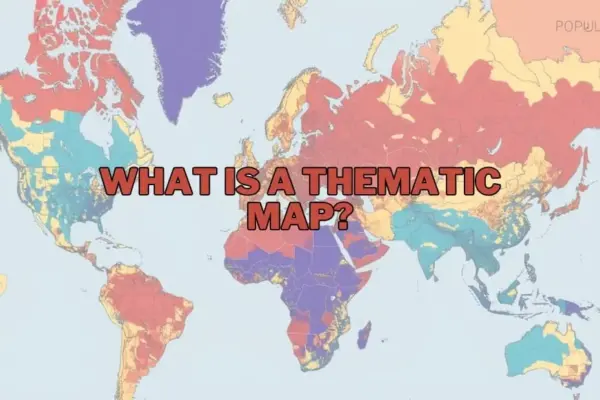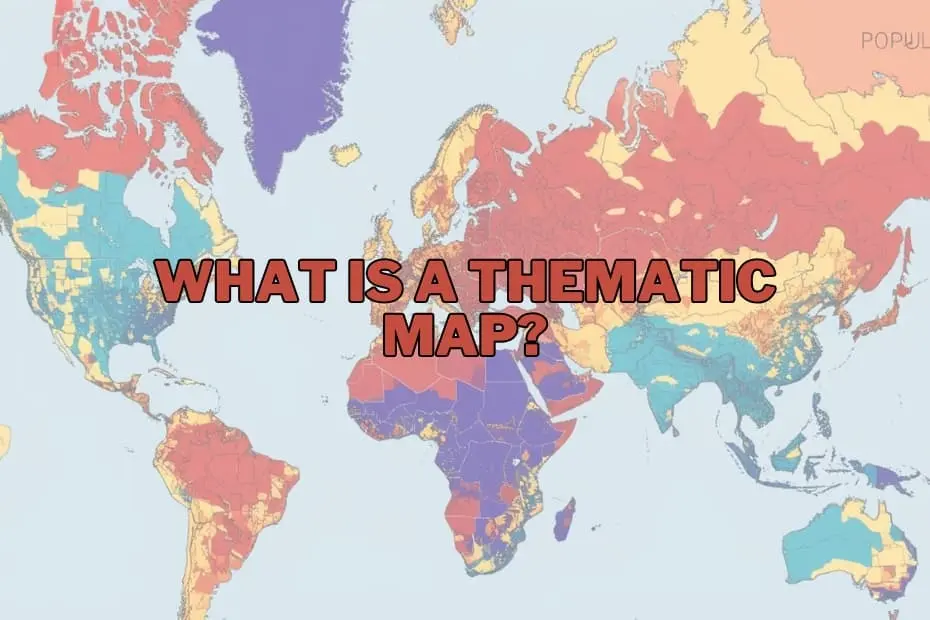
In the expanding landscape of data visualization and geographical analysis, maps serve as far more than navigational aids for travelling from one location to another. Modern cartography offers a framework for uncovering hidden trends, communicating complex spatial relationships, and contextualizing raw data within a geographic reality. While standard reference maps depict essential physical structures like highways, coastlines, rivers, and municipal boundaries, thematic maps address a distinct imperative: illustrating the spatial distribution of a specific concept, phenomenon, or dataset across a designated territory.
Whether highlighting population density, regional climate variations, economic indicators, or public health metrics, thematic maps translate abstract numerical data into spatial narratives. For researchers, urban planners, public health officials, and corporate analysts, these specialized maps act as an indispensable bridge between complex data science and clear visual communication.
Purpose and Importance of Thematic Maps
The core purpose of a thematic map is to communicate spatial data effectively, converting intricate datasets into digestible visual formats. By mapping specific attributes across geographic boundaries, cartographers and analysts can observe patterns, correlations, and anomalies that remain obscured in traditional spreadsheets or text reports.
The importance of this visual methodology spans multiple sectors. In environmental management, thematic maps allow researchers to track temperature changes, deforestation rates, or agricultural yields to better understand the localized impacts of global climate change. In municipal management, urban planners rely on demographic mapping to evaluate housing demands, optimize transit routes, and allocate civic infrastructure. By providing a spatial context for qualitative and quantitative metrics, thematic maps deliver actionable insights that directly inform policy, strategic planning, and operational decision-making.
Types of Thematic Maps
Different data structures require distinct mapping methodologies. Thematic cartography encompasses several specialized formats, each engineered to present specific data types and spatial relationships effectively:
- Choropleth Maps: Among the most widely used thematic map types, choropleth maps employ varying shades, patterns, or colors to represent aggregated statistical values within predefined geographic units, such as countries, states, or zip codes. They are ideal for depicting standardized data, such as literacy rates, median income, or population density.
- Isoline (Isarithmic) Maps: Isoline maps utilize continuous lines to connect geographic points that share identical data values. Commonly applied to phenomena that vary continuously across space without regard to administrative boundaries, these maps illustrate variables such as elevation contours (topographic maps), atmospheric pressure (isobars), or annual precipitation patterns (isohyets).
- Proportional and Graduated Symbol Maps: These maps display symbols—frequently circles or squares—at specific locations, adjusting the size of the symbol in direct proportion to the magnitude of the dataset being represented. This approach is effective for highlighting point-based quantities, such as individual port capacities, city populations, or earthquake intensities.
- Dot Density Maps: Utilizing uniform dot markers, dot density maps represent a fixed quantity of a phenomenon across a geographic space. By scattering dots within specified boundaries based on regional statistics, these maps offer an intuitive visual representation of spatial concentration and dispersion without implying uniform distribution across an entire administrative zone.
- Cartograms: Cartograms intentionally distort geographic shapes, land areas, or distances based on a specific statistical variable. For example, a global population cartogram scales national landmasses according to total population rather than actual physical size, providing an immediate visual impact regarding global demographic distribution.
Key Elements of a Thematic Map
Creating an accurate and legible thematic map requires careful cartographic design. To ensure that spatial data is conveyed clearly without misleading the user, a thematic map should incorporate several fundamental structural elements:
- Clear A precise title provides immediate context, identifying the map’s subject matter, geographic location, and timeframe.
- Map Legend or Key: The legend defines the colors, patterns, symbols, and scales used across the map, enabling readers to translate visual graphics into meaningful quantitative or qualitative information.
- Map Scale: A graphic, verbal, or numerical scale indicates the mathematical relationship between distances on the map and actual ground distances, maintaining spatial proportion.
- Data Sources and Metadata: Documenting the underlying sources of information ensures credibility, allowing viewers to evaluate data accuracy, collection methodology, and timeliness.
- Orientation Indicators: A compass rose or north arrow establishes basic directional context, ensuring proper spatial alignment for geographical interpretation.
- Appropriate Color Schemes and Visual Hierarchy: The selection of color ramps—whether sequential, diverging, or categorical—must align logically with the nature of the dataset to guide the reader’s focus naturally toward primary analytical insights.
Applications Across Diverse Fields
The utility of thematic mapping extends far beyond academic geography, playing a vital role in operations across public and private sectors:
- Public Health and Epidemiology: Health organizations utilize thematic maps to trace disease outbreaks, monitor vaccination coverage, identify environmental health risks, and allocate healthcare resources efficiently across affected populations.
- Urban Planning and Development: City officials map land use patterns, zoning designations, infrastructure capacity, and socio-economic distributions to guide sustainable development projects and emergency service coverage.
- Business Intelligence and Market Research: Commercial enterprises employ spatial mapping to identify target consumer demographics, select optimal locations for retail expansion, analyze supply chain logistics, and evaluate competitor density.
- Environmental Science and Resource Management: Environmental analysts apply thematic mapping to track ecological degradation, manage natural reserves, monitor wildlife habitats, and assess disaster risks such as flood zones or wildfire hazards.
- Political Science and Demographics: Political strategists and researchers leverage spatial visualizations to analyze election results, model voting behavior trends, monitor redistricting efforts, and understand broader demographic shifts over time.
Advantages of Thematic Maps
The primary advantage of thematic maps lies in their capability to simplify high-density datasets into accessible graphic formats. By capitalizing on human visual perception, thematic visualizations allow users to synthesize spatial patterns, identify geographical hot spots, and recognize regional disparities far more rapidly than tabular numerical data allows.
Furthermore, thematic maps facilitate multi-layered comparative analysis. By overlaying demographic features, climate data, and economic markers within unified spatial software environments, decision-makers can uncover subtle cross-disciplinary correlations. This spatial intelligence improves strategic planning, enhances public communication, and supports evidence-based policy formulation.
Limitations of Thematic Maps
Despite their analytical utility, thematic maps present inherent design challenges and potential limitations that must be managed during interpretation:
- Generalization and Visual Distortion: Aggregating continuous or localized data into fixed regional boundaries (such as states or counties) can obscure micro-level variations within those regions.
- Data Classification Bias: The choice of statistical classification methods—such as equal intervals, natural breaks, or quantiles—can substantially alter the visual appearance of a choropleth map, potentially overemphasizing or minimizing specific trends.
- Misleading Scale and Boundary Effects: Administrative boundaries rarely correspond strictly to natural or socio-economic phenomena, which can create artificial edges or cause viewers to assume uniform conditions across broad mapped units.
- Dependence on Input Data Quality: A thematic map is entirely dependent on the precision, completeness, and recency of its underlying source data; flawed baseline data inevitably yields misleading spatial visualizations.
Tools and Software for Creating Thematic Maps
Advances in digital geographic technology have made the creation of thematic maps increasingly accessible to spatial analysts, researchers, and public communicators. A broad range of specialized software applications and platforms supports thematic cartography:
- Geographic Information System (GIS) Software: Enterprise and open-source GIS software platforms, such as QGIS and ArcGIS, offer comprehensive cartographic suites. These tools support complex spatial analysis, advanced data classification techniques, custom projections, and high-precision cartographic output.
- Business Intelligence and Data Visualization Platforms: Software tools like Tableau and Power BI integrate spatial mapping features directly into enterprise dashboards, enabling users to link location data with live corporate metrics and performance indicators.
- Web-Based Mapping Libraries and Cloud Tools: Modern web-mapping frameworks and cloud platforms facilitate dynamic, interactive map design for public presentation, enabling visual artists and developers to display time-series maps and interactive dashboards on the web.
Frequently Asked Questions
What is the difference between a thematic map and a reference map?
A reference map prioritizes spatial location and navigation, illustrating physical and human-made geographical features such as roads, landforms, rivers, and political boundaries. In contrast, a thematic map focuses on visual representation of a specific variable or dataset, using spatial framework primarily to illustrate statistical trends, patterns, or regional characteristics.
Can thematic maps be used for historical data?
Yes, thematic maps are frequently used to visualize historical phenomena. They allow researchers to map demographic changes across different eras, track historical military troop movements, document changing land use patterns over time, and trace past disease outbreaks to identify long-term temporal trends.
What software is best for beginners to create thematic maps?
For beginners entering spatial mapping, open-source platforms like QGIS offer robust features at no cost, supported by extensive community documentation. Additionally, data visualizers often start with platforms like Tableau or accessible web-mapping applications, which provide intuitive drag-and-drop interfaces for creating basic thematic visualizations without requiring extensive coding skills.
How do I choose the right type of thematic map for my data?
Selecting the appropriate thematic map depends on the structure of the dataset and the specific analytical story being communicated. Continuous numerical data without spatial boundaries (like temperature or elevation) works best with isoline maps. Aggregated regional statistics (like population density per county) are suited for choropleth maps, while discrete point datasets with variable quantities are ideal for proportional symbol or dot density maps.
Are thematic maps only used in geography?
No. While rooted in cartographic principles, thematic maps are utilized across a vast range of disciplines, including business analytics, epidemiology, public policy, environmental research, urban management, economics, and journalism.