In the realm of professional presentations and data visualization, color is frequently scrutinized for its potential to backfire. From accessibility concerns for individuals with color vision deficiencies to the psychological impact of certain hues, presenters are increasingly mindful of how they deploy color palettes. However, color is not the only attribute of a visual display that can completely derail communication. Motion, when deployed without careful consideration, can be equally hazardous to audience comprehension.
This reality was brought sharply into focus during a company-wide meeting at a previous employer, where a senior leader took the stage to unveil a suite of new software products and features. To demonstrate the versatility of the new tool, the presenter introduced various types of charts using dynamic animations embedded directly into the presentation slides. As each individual chart flew across the screen, the visual movement immediately hijacked the attention of audience members whose cognitive processing styles react intensely to motion.
For professionals who live with inattentive attention deficit/hyperactivity disorder (ADHD), the impact of unvetted motion can be profound. Many individuals with ADHD are exceptionally tuned to movement in their environment, a trait rooted in how the brain processes stimuli and maintains focus. When confronted with objects zipping across a presentation screen, the reaction can mirror that of a dog spotting squirrels darting past a window. In that moment, cognitive resources shift entirely to tracking the movement, rendering the surrounding context invisible. The result is that not a single detail about the data charts is absorbed, and every word spoken by the presenter vanishes into the background noise.
The leader orchestrating that presentation had simply not considered how dynamic motion might act as a severe distraction to any audience member, let alone those with specific neurodivergent traits like ADHD. This scenario raises a critical question for professionals across all industries: what could the presenter and the audience member have done differently to bridge this communication gap?
At the heart of the misstep lay a shared oversight—both parties underestimated the vital importance of the audience, while simultaneously leaning far too heavily on a single attribute of visual design. In the ongoing discourse surrounding effective communication and data presentation, the composition of the audience remains a central pillar. Knowing who is sitting in the room or viewing the screen is just as crucial as understanding the underlying science of visual design.
Learn what works for your audience
The challenges that impede effective communication are not always rooted in simple personal preferences or stylistic disagreements. Frequently, they are tied to fundamental differences in how human eyes and brains function. Navigating these complexities requires a dual approach. The first strategy is to invest the necessary time to truly understand the audience long before stepping up to a podium or publishing a report. The second strategy involves layering multiple design attributes together, an intentional practice that significantly reduces the risk that a single-minded approach will miss the mark entirely.
When professionals have direct access to their intended audience, the path forward involves bringing concrete examples directly to them and initiating a dialogue. Asking targeted questions about how they interact with information can reveal preferences and potential pain points that would otherwise remain hidden. Yet, direct access is a luxury that is not always available. When professionals cannot consult their audience directly, alternative methods become necessary to understand what viewers might expect, how they process information, and what visual habits they rely on in their daily work.
Conducting preliminary research is not a direct substitute for actively working alongside an audience, but it can provide a substantial competitive advantage and help establish a strong first impression. Examining real-world examples of how a specific demographic talks about data, designs visual reports, and presents complex information can illuminate the most effective path forward. By studying these existing patterns, communicators can tailor their materials to align more closely with the cognitive habits of the people they need to reach.
Combine attributes thoughtfully
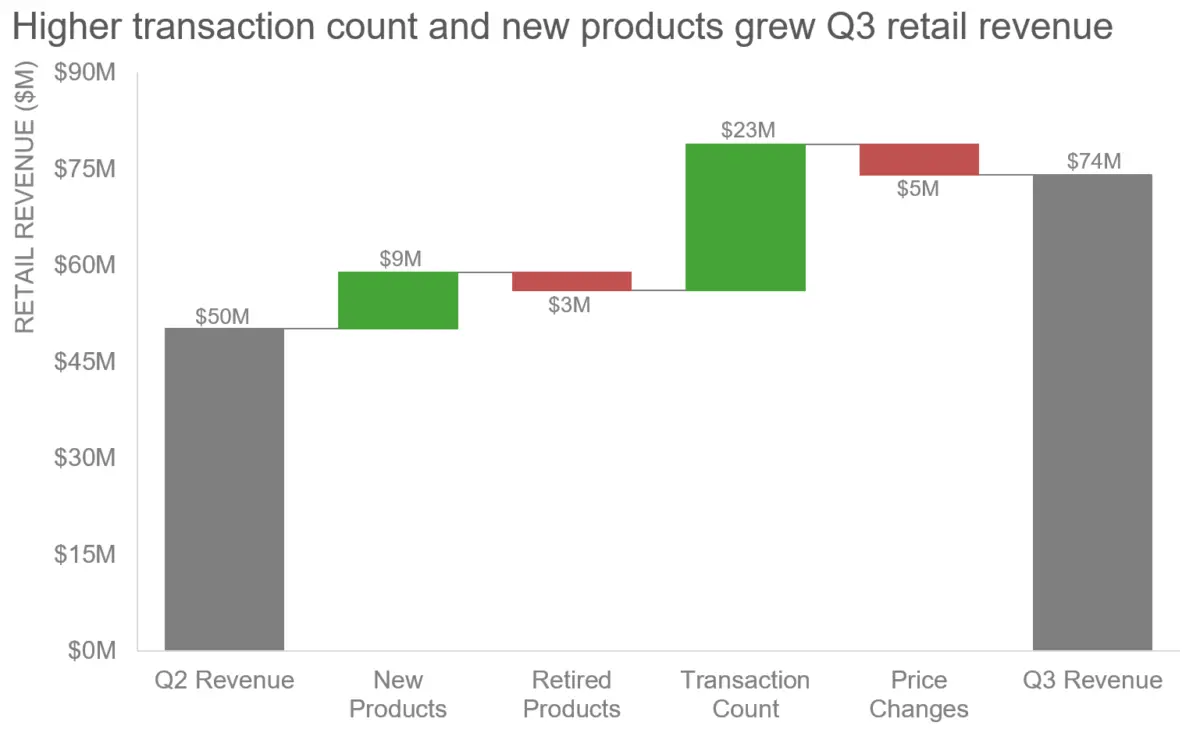
To understand how thoughtful design can rectify these common pitfalls, it is helpful to examine how single-attribute reliance creates failure. Consider the example of a green and red waterfall chart, where color alone is expected to carry the entire weight of the message. Color can still function effectively as a communication tool, but only when it is deployed with greater strategic intent rather than as a blunt instrument.
Addressing the limitations of single-attribute design requires a deliberate shift in methodology. In the case of the waterfall chart, updating the visual representation means moving away from a reliance on color alone and integrating complementary design principles. By refining how data points are structured, labeled, and presented in tandem with color, communicators can ensure that the core message is conveyed accurately to everyone in the audience, regardless of how their individual visual or cognitive systems process information.