The powerful climate phenomenon known as El Niño is rapidly pushing into uncharted territory this year, with tropical Pacific sea surface temperatures equaling previous historical daily highs and continuing on a steep upward trajectory.
El Niño is a naturally occurring, periodic climate driver originating in the Pacific Ocean that fundamentally alters atmospheric and oceanic circulation patterns across the globe, while temporarily elevating average global temperatures. The current event, which officially took shape in June and is projected to persist well into next year, has developed at an unprecedented pace, easily outpacing the initial development rates of any previously documented event in the instrumental record.

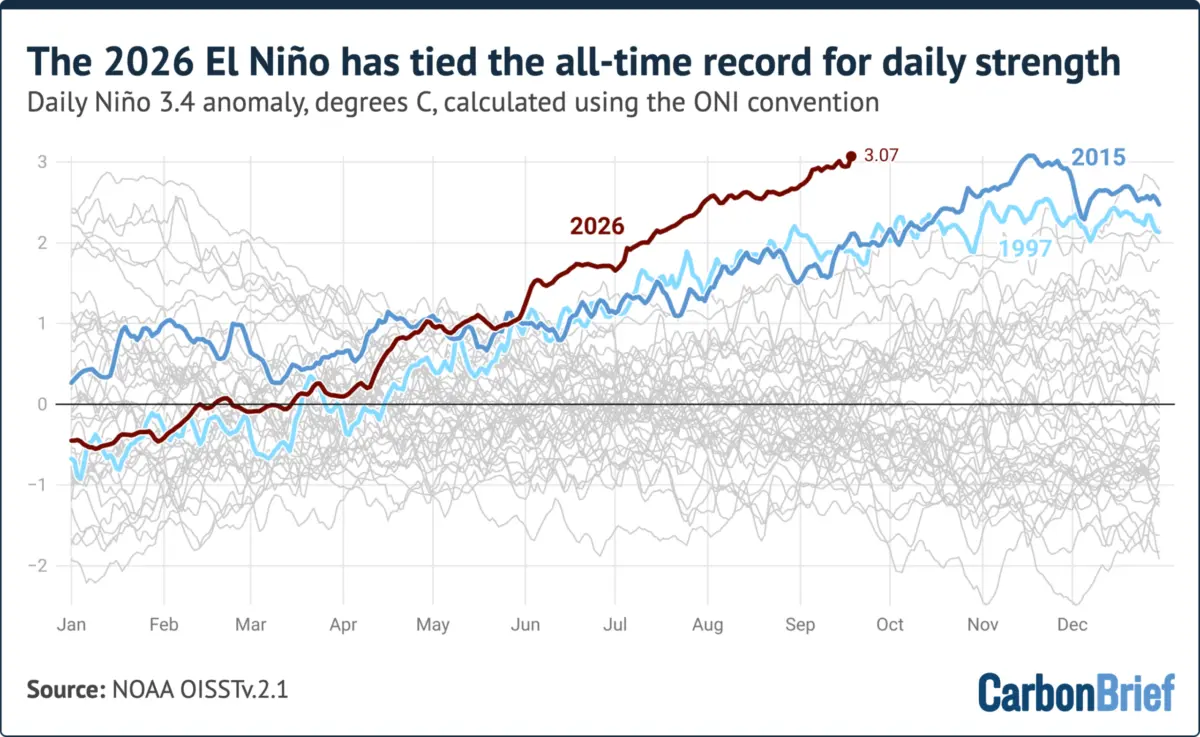
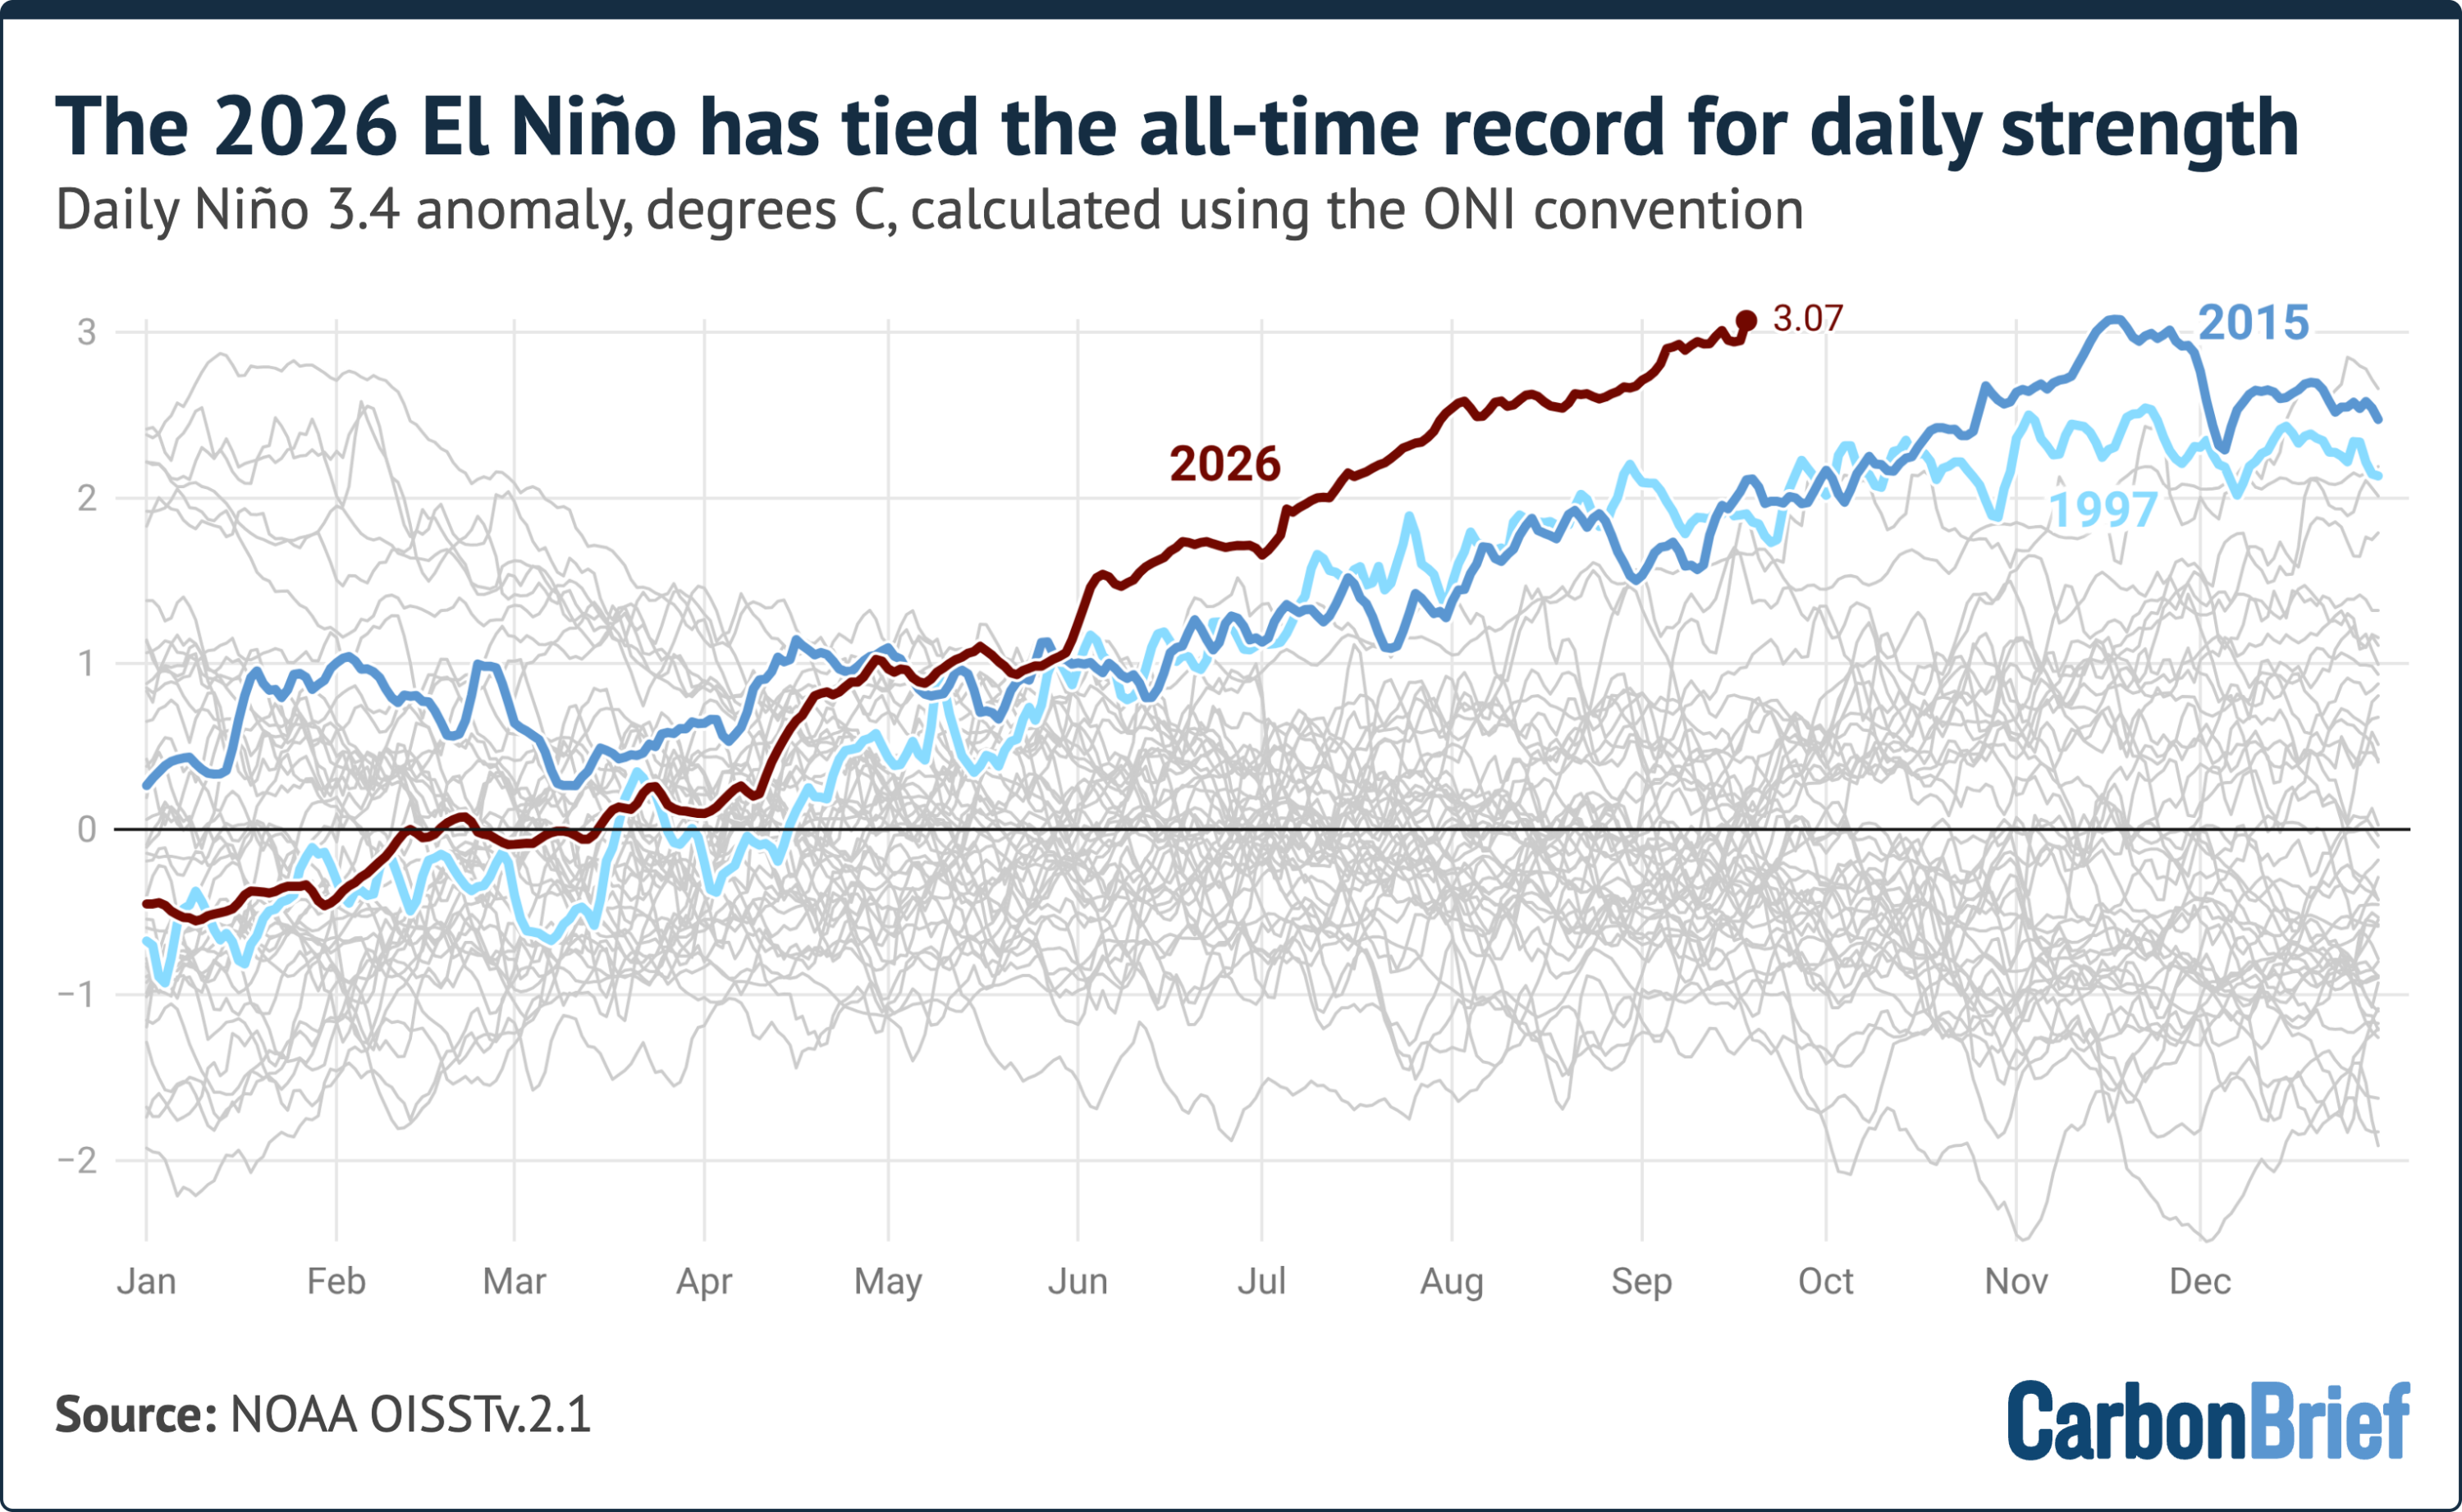
Scientists track the intensity of these climate events primarily through the "Niño 3.4 anomaly," a metric that calculates how much warmer sea surface temperatures are compared to average conditions within a designated section of the central Pacific. As of September 19, the daily anomaly in the Niño 3.4 region reached 3.07 degrees Celsius. This reading places the current event in a statistical dead heat with the previous daily record of 3.08 degrees Celsius, which was established during the powerful 2015 El Niño. Depending on the specific meteorological baseline used for calculations, some researchers utilizing alternate reference periods have already declared a new all-time daily record.
What makes this surge particularly remarkable to climatologists is its timing. El Niño events typically experience their most intense phases during the Northern Hemisphere winter months, most commonly peaking in November or December. Historically, every strong El Niño on record has continued to intensify past mid-September, creating a strong scientific consensus that the current event will follow a similar trajectory in the coming months.
Record Territory
Within climatology, El Niño events are categorized by thresholds based on the Niño 3.4 anomaly. An event is generally classified as weak when the anomaly reaches 0.5 degrees Celsius, moderate above 1 degree Celsius, strong above 1.5 degrees Celsius, and very strong when it surpasses 2 degrees Celsius.
The current event’s anomaly of 3.07 degrees Celsius equals the peak daily levels observed on November 18, 2015, during a historically massive and very strong El Niño cycle. Observational data shows that the strength of this year’s phenomenon has dramatically outpaced both the 2015-16 event and another major very strong event that occurred in 1997-98.
To analyze these developments, researchers frequently rely on conventions established by the United States National Oceanic and Atmospheric Administration, specifically the Oceanic Niño Index. The ONI is derived by subtracting the most recent 30-year average temperature in the Niño 3.4 region from daily sea surface measurements. This methodology allows contemporary temperatures to be evaluated against a modern climate baseline, effectively filtering out a significant portion of long-term, human-driven background warming from the index. While operational meteorological agencies typically monitor ONI changes through a three-month rolling average, daily tracking provides a granular look at the rapid evolution of the current phenomenon. When utilizing a baseline spanning from 1991 to 2020, data confirms that the ongoing El Niño has already surpassed all previous benchmarks.
Since the beginning of June, the intensity of the event has consistently remained higher than any comparable period in recorded history. By early September in both 1997 and 2015, regional anomalies hovered around 1.9 degrees Celsius, sitting more than a full degree below the extraordinary levels recorded this year.
An Alternative Index
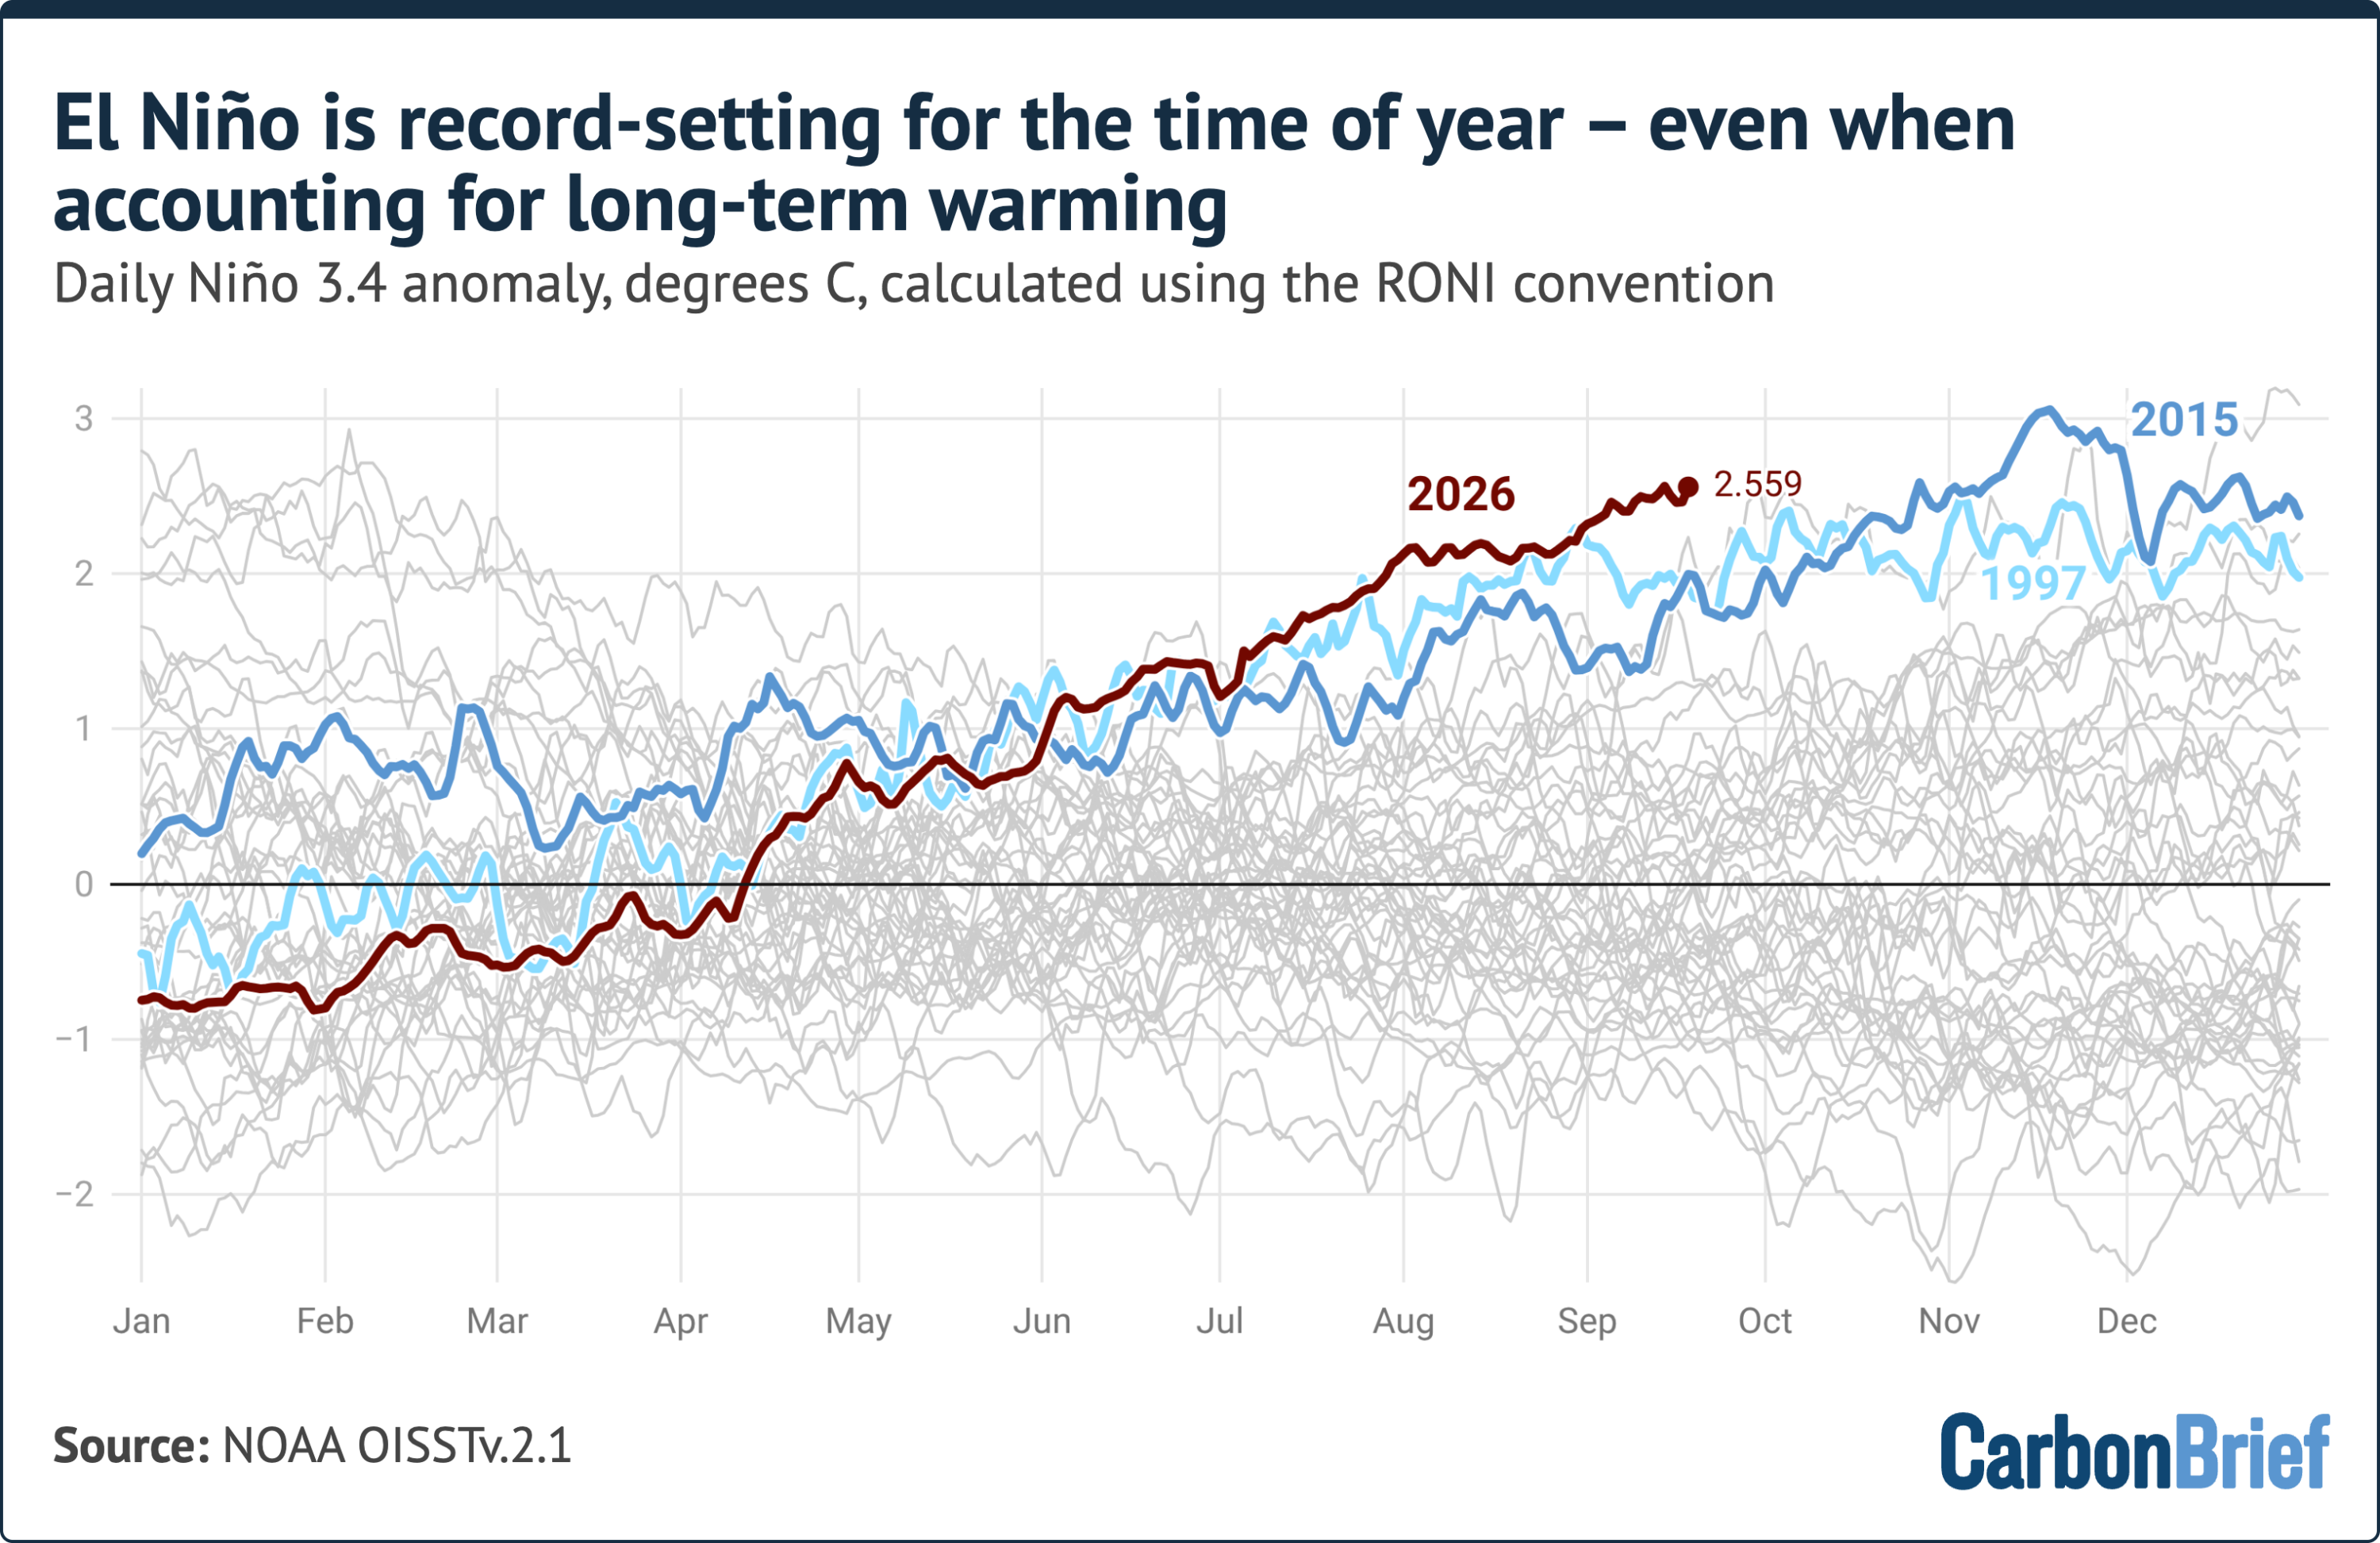
To gain a comprehensive understanding of these climate dynamics, scientists also utilize complementary metrics, such as the relative Oceanic Niño Index, or RONI. Introduced by NOAA, the RONI metric is designed to explicitly adjust for widespread tropical ocean warming driven by anthropogenic climate change. It achieves this by taking sea surface temperature averages in the Niño 3.4 region and subtracting out the broad temperature anomalies observed across the entire tropical ocean expanse between 20 degrees north and 20 degrees south latitude.
While this relative approach successfully isolates regional variability from broader global warming trends, it can sometimes diminish the apparent magnitude of exceptionally intense El Niño events, particularly those like the current one where warm surface anomalies extend well beyond the traditional boundaries of the Niño 3.4 box.

Daily RONI values for the ongoing event are setting records for this specific time of year, though they remain below the absolute daily record established during the historic 1982-83 El Niño. In mid-September, the RONI value stood at approximately 2.5 degrees Celsius, roughly 0.7 degrees below the 1982 peak. However, that historical peak occurred in late December at the absolute zenith of the event. Historical data indicates that major events, including those in 1982-83, 1997-98, and 2015-16, typically added between 0.5 and 1.9 degrees Celsius to their RONI values during the final months of the year as they marched toward their seasonal maximums.
On Track to Smash Monthly and Seasonal Records
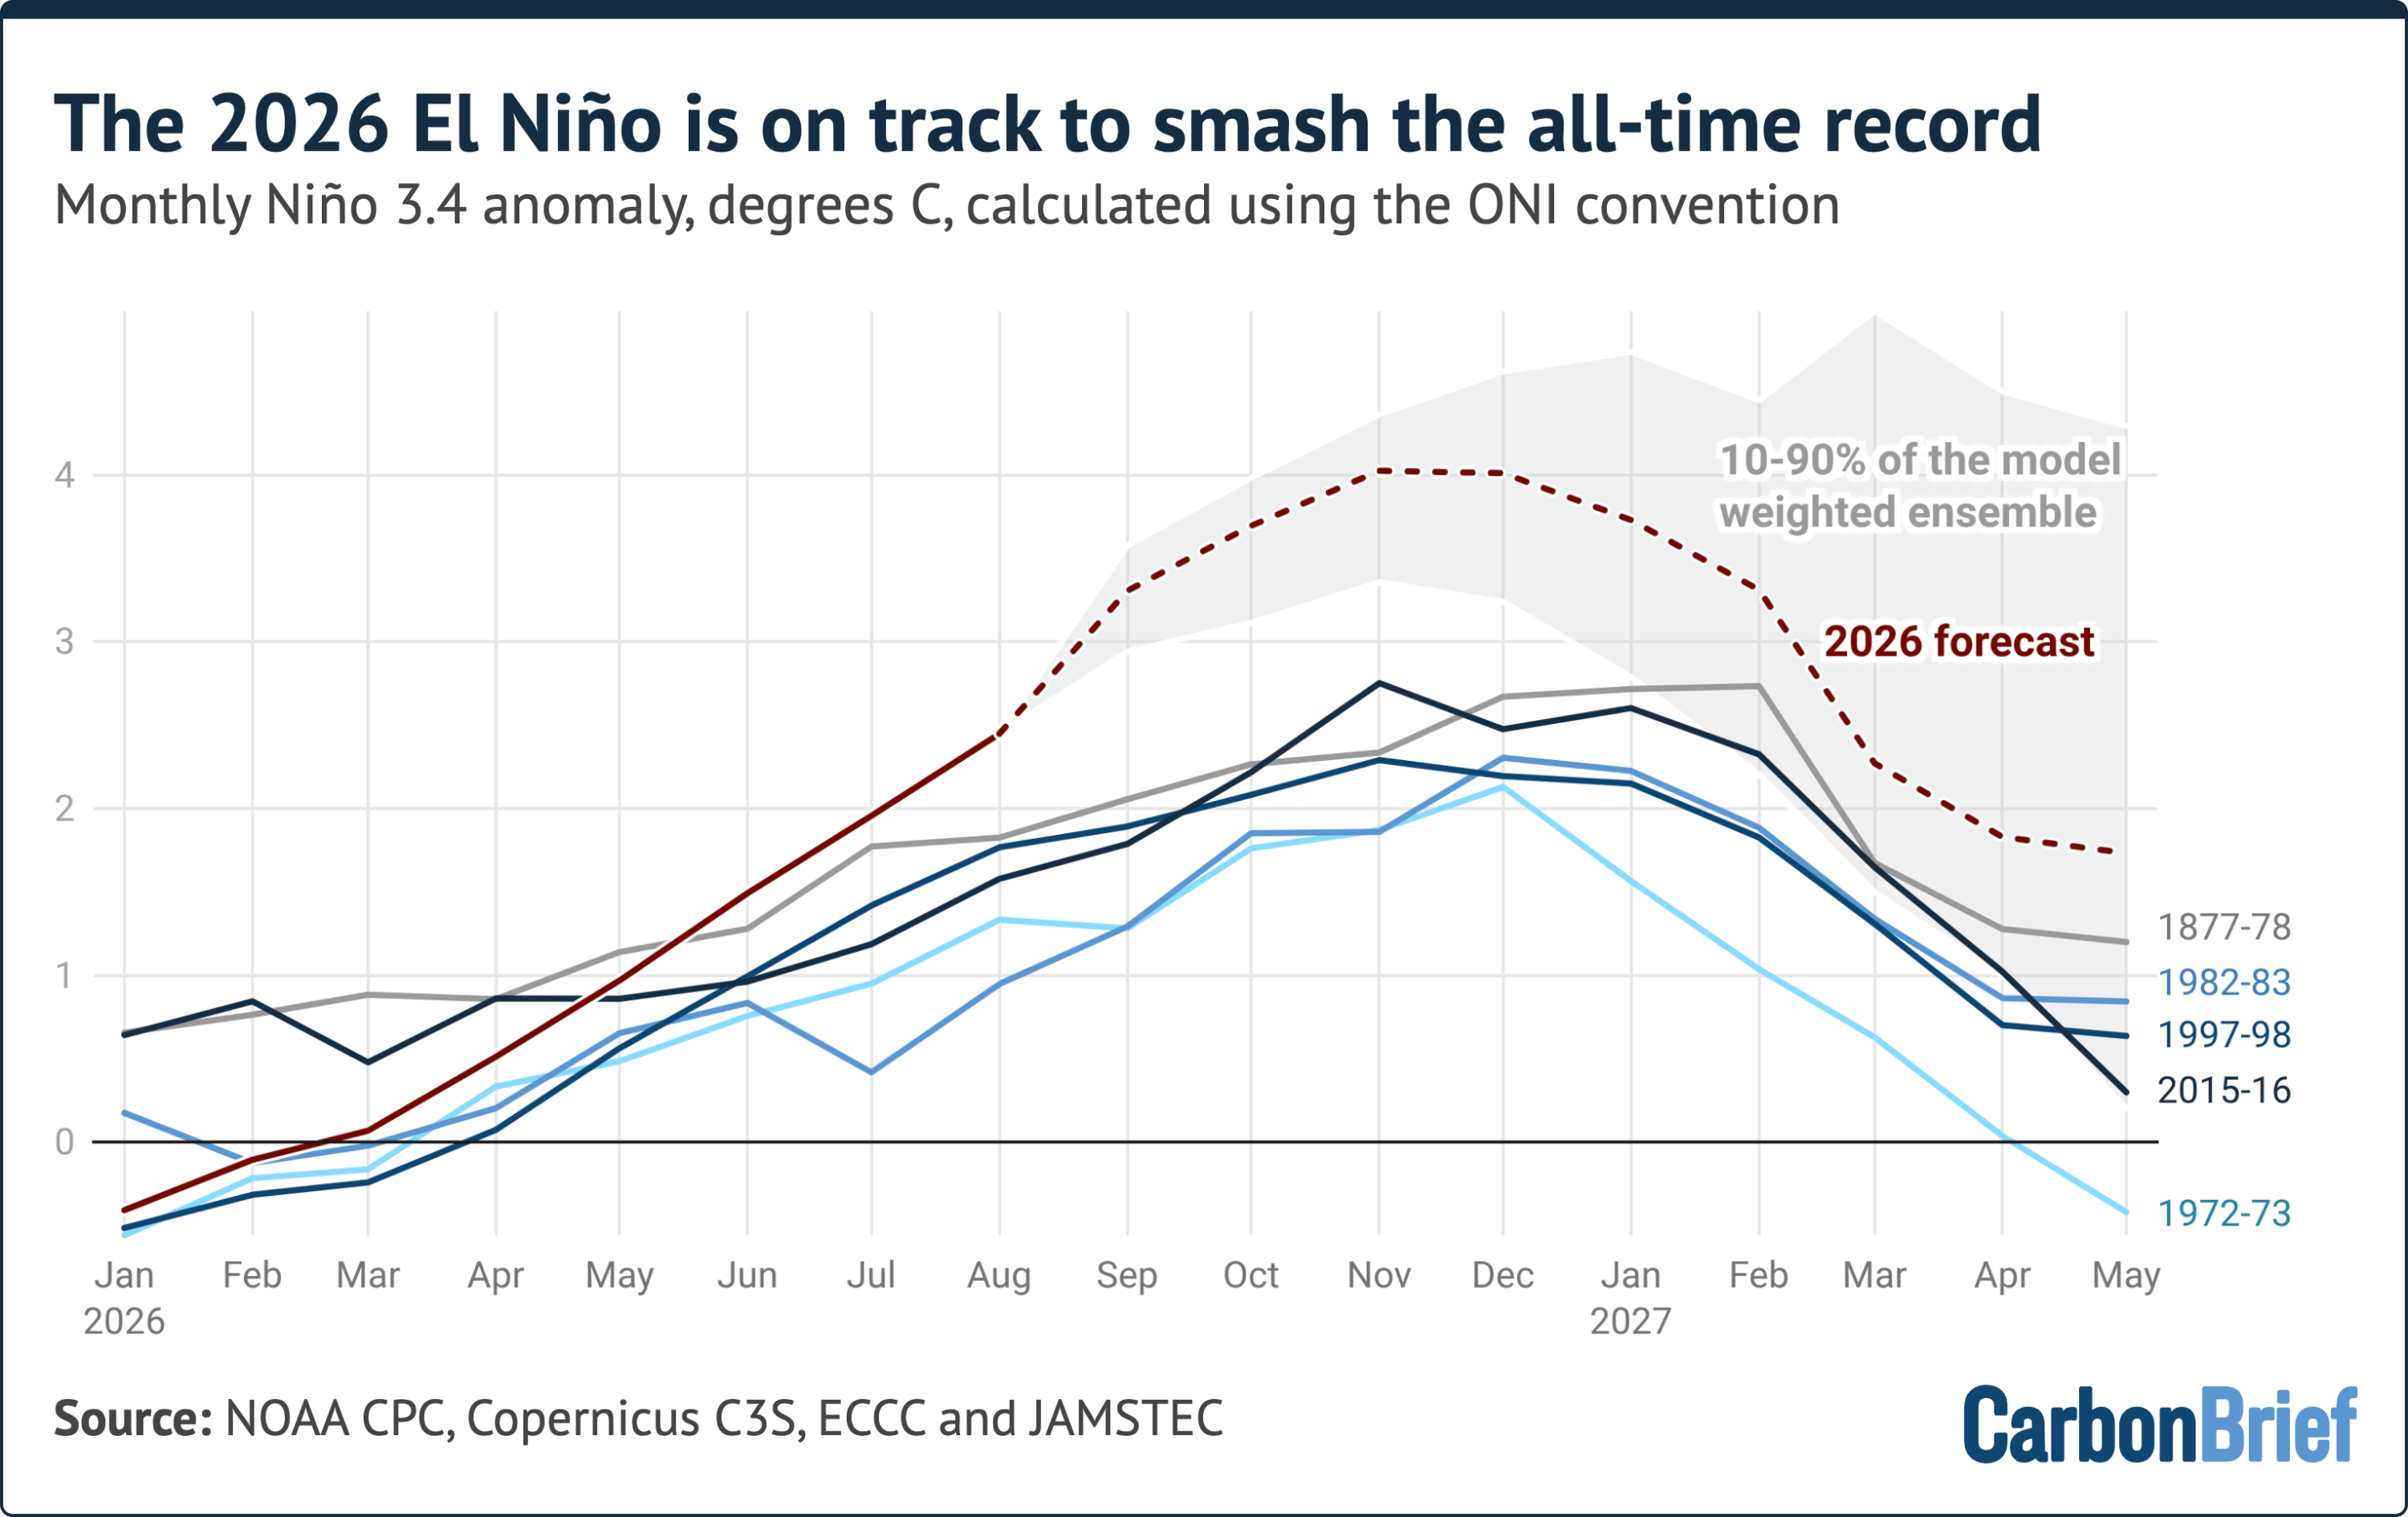
Because daily El Niño metrics can exhibit significant short-term variability and statistical noise, researchers rely on monthly and seasonal averages to conduct meaningful historical comparisons. The final full calendar month with finalized data, August, registered a Niño 3.4 anomaly of approximately 2.45 degrees Celsius. This monthly figure is higher than the peak of nearly every prior El Niño on record, with only the 2015-16 event—which reached a monthly anomaly of 2.75 degrees Celsius—and historical ship-data reconstructions from the 1877-78 event sitting higher.
Projections synthesized from numerous global seasonal forecast models indicate that the monthly anomaly will continue to climb, pointing toward a potential peak later in the year of around 4.1 degrees Celsius. The vast majority of individual model runs project peak anomalies falling within a range of 3.4 to 4.6 degrees Celsius. Remarkably, every single model simulation projects a peak that exceeds the record set during the 2015-16 event. The projected margin over that previous benchmark—roughly 1.3 degrees Celsius—is larger than the entire gap separating the strongest and fifth-strongest El Niño events observed over the past 150 years.
Meteorologists and climate scientists urge a degree of caution regarding these extreme projections, noting that no seasonal forecasting system has ever been tested or verified against an event of this unprecedented magnitude because one has never been recorded. Furthermore, some models slightly overpredicted temperatures during the summer months, with real-world observations for August coming in about 0.3 degrees Celsius below earlier model forecasts.

Nevertheless, historical precedent shows that all strong El Niño events continue to intensify steadily into the winter months, and global forecasting models display near-unanimous agreement that the current phenomenon will do the same. If these projections materialize, the ongoing event will peak between November and January at a scale far exceeding anything documented in the modern instrumental record.
Because the atmospheric response to Pacific ocean warming typically involves a temporal lag of several months, the most profound global weather disruptions and temperature spikes associated with this event are expected to manifest fully in the year ahead rather than immediately. Ongoing quarterly climate assessments indicate that current conditions keep global temperatures on an elevated trajectory, with researchers continuing to monitor how a record-shaping El Niño will influence worldwide weather patterns, regional precipitation, and ecological systems in the coming months.