The data visualization community is heading back to the drawing board to master one of analytical storytelling’s most dynamic tools. Storytelling with Data (SWD), a prominent platform dedicated to elevating data communication and visual design skills, has officially announced its latest monthly community challenge. This time, the global initiative centers entirely on the waterfall chart, inviting analysts, designers, and professionals from various industries to explore new ways of visualizing incremental changes, cumulative values, and sequential data narratives.
The announcement draws inspiration from the rugged landscape of the Pacific Northwest in the United States, where the platform’s team members often seek inspiration amidst nature. Known for its rocky beaches, hidden waterways, uninhabited islands, and sweeping mountain ranges frequently draped in coastal fog, the region serves as a striking backdrop for creative thought. During the summer months, local hiking trails often lead to cascading alpine destinations. Washington state alone boasts over 2,900 waterfalls, a geographic distinction that includes Colonial Creek Falls, recognized as the tallest waterfall in the continental United States.
Nature’s grandeur has a unique way of sparking professional creativity. A recent trek to one of the region’s numerous waterfalls prompted a fresh look at a favorite analytical tool: the waterfall chart. In the realm of data visualization, waterfall charts hold a revered status as exceptionally powerful instruments for narrative storytelling. Unlike standard bar charts or line graphs that merely display discrete points or overarching trends, waterfall charts uniquely illustrate a complete chronological or categorical journey. They vividly demonstrate a starting point, detail the specific positive and negative factors that drove change along the way, and clearly reveal the final ending value.
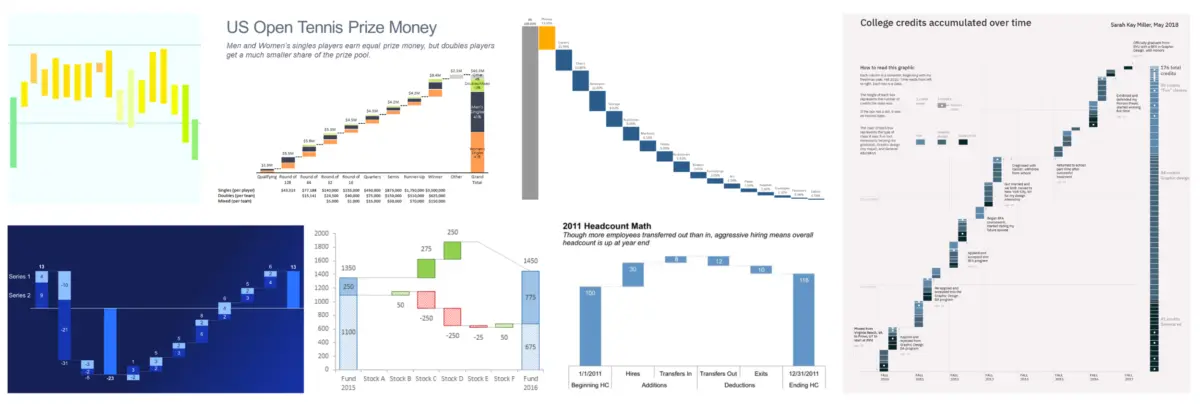
While the SWD community previously explored waterfall charts during a challenge years ago, organizers believe it is an ideal time for a modern reassessment. Historically, these specialized charts have found their primary utility in corporate finance and sales operations, frequently deployed for sales breakdowns, variance analyses, and cause-of-change evaluations. However, their structural flexibility extends far beyond traditional financial statements. Waterfall charts can be adapted effectively for tracking human resources headcounts, monitoring complex subscription and customer churn data, or even illustrating score changes and momentum shifts over the course of a competitive sports match.
From a design and communication standpoint, waterfall charts offer distinct operational advantages. They work exceptionally well during live walkthroughs and presentations, allowing a speaker to dedicate focused time to discussing crucial intermediate bars—the specific drivers of growth or decline—in the middle section of the chart. Simultaneously, they provide valuable white space in written reports and executive communications, giving the audience’s eyes room to breathe and processing the information without visual clutter. By inviting the global data community to share diverse use cases, organizers hope to uncover innovative applications and fresh perspectives on this classic chart type.
The Challenge
Participants in the newly launched challenge are tasked with sharing their own unique waterfall chart stories. Submissions can utilize proprietary workplace data, publicly available datasets from open-source repositories, or classic examples provided within the storytelling community’s learning resources. As is standard practice for professional data ethics, participants handling sensitive corporate or personal metrics are strongly reminded to completely anonymize any data that cannot be shared openly in the public domain.
For practitioners who may be newer to this specific visualization technique, the initiative provides access to a curated selection of foundational resources. These materials cover the technical mechanics of building a waterfall chart across various software applications, alongside essential design considerations to ensure clarity, accuracy, and aesthetic appeal. Whether a participant chooses to tackle a serious corporate case study or craft a lighthearted narrative for pure creative enjoyment, the ultimate goal is to tell a compelling story that inspires others in the field.
All entries must be submitted through the official Storytelling with Data community portal by August 31 at 5:00 PM Pacific Time. Participants who are looking for targeted critique or specific constructive feedback on their visual designs are encouraged to include those details directly within their submission commentary to guide reviewers and fellow community members.