An updated hurricane forecast map designed to make it easier for the public to identify areas threatened by severe weather is achieving mixed results, according to new research from Florida State University. While the revised graphic successfully helps people recognize when inland areas are under hurricane and tropical storm watches, it falls short of motivating them to feel more at risk or prompting them to take proactive safety precautions.
The study, which evaluated an experimental graphic developed by the National Hurricane Center (NHC) in 2024, sheds light on the ongoing psychological and cognitive challenges of communicating complex meteorological hazards to a general audience. The findings were recently published in the American Meteorological Society journal Weather, Climate, and Society.
Researchers from Florida State University’s School of Communication within the College of Communication and Information, alongside the Department of Geography, set out to examine whether recent modifications to official hurricane forecast graphics genuinely improve public understanding of severe weather threats. The interdisciplinary research team included lead author Assistant Professor Elizabeth Ray, co-author and School of Communication Director Patrick Merle, and Bradford Johnson, an assistant professor in the Department of Geography.
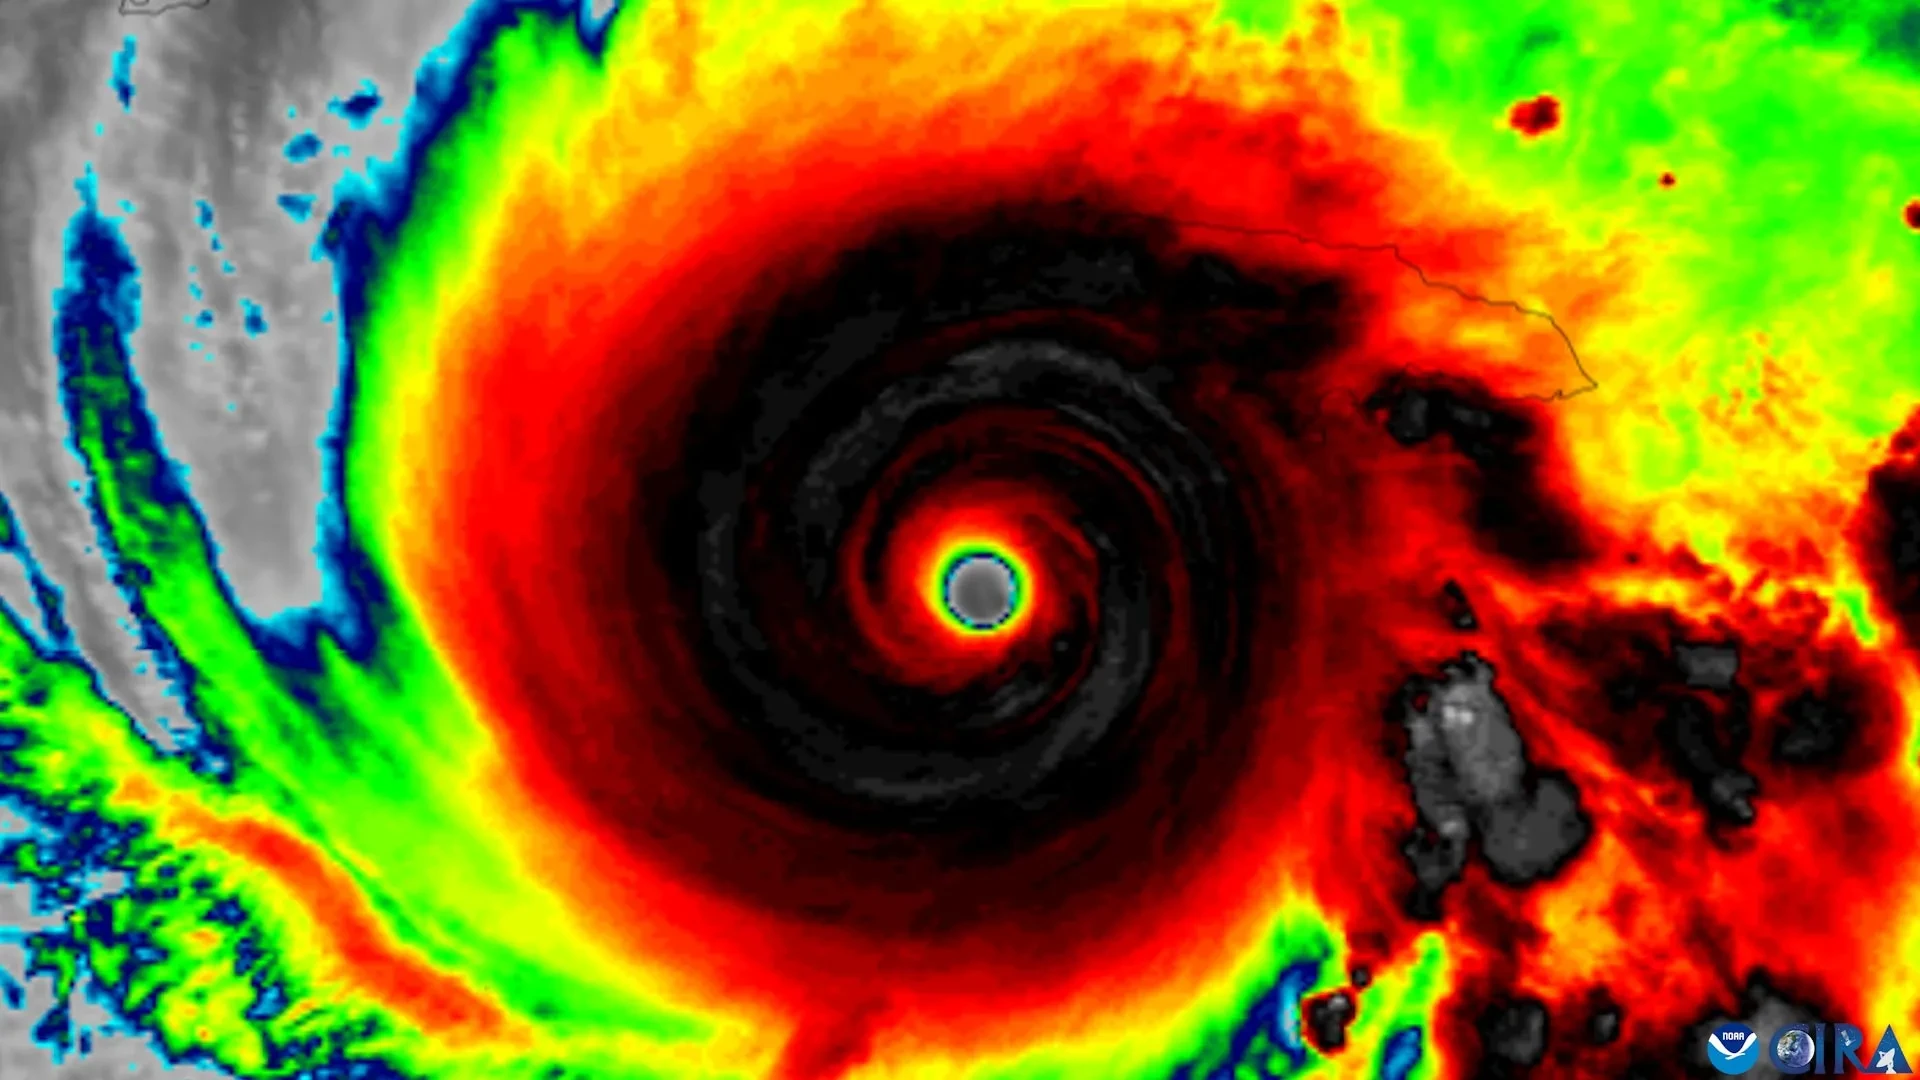
The experimental graphic evaluated in the study expands the traditional hurricane forecast cone—a familiar sight on television screens and digital devices during hurricane season—to explicitly include tropical storm and hurricane watches and warnings for inland regions. Historically, the conventional cone has placed a heavy visual emphasis on coastal communities. However, meteorological data consistently demonstrates that dangerous storm conditions, including high winds, torrential rainfall, flooding, and tornadoes, can extend far inland, endangering residents well away from the shoreline.
Evaluating Public Perception of Inland Storm Threats
To investigate how the public interprets these critical weather forecasts, the research team conducted a comprehensive survey involving residents across Florida and Georgia, two states frequently impacted by tropical systems. During the study, participants were shown either the traditional hurricane cone graphic or the newer experimental version that incorporates additional data regarding inland storm threats.
The results revealed a nuanced picture of public comprehension. Participants who viewed the revised map were significantly more successful at identifying geographic locations placed under hurricane or tropical storm watches. However, that improved spatial recognition did not translate into a heightened sense of personal danger, nor did it result in stronger intentions among participants to take necessary safety precautions. Furthermore, the study noted that participants showed no measurable improvement in correctly identifying areas covered by official storm warnings.
The findings underscore a persistent communication hurdle that has long challenged meteorologists and emergency management officials: ensuring that accurate scientific data drives appropriate human behavior.
"The National Hurricane Center has made a number of thoughtful changes to improve how hurricane information is communicated," Assistant Professor Elizabeth Ray said. "We had a simple question. Do those changes actually help people understand what the graphic is telling them about the risk they face?"
Why People Misunderstand Hurricane Forecast Maps
Beyond evaluating the inclusion of inland watches and warnings, the research also highlighted enduring misconceptions surrounding the classic hurricane "cone of uncertainty." Despite decades of public education campaigns by weather agencies, many people continue to misinterpret the physical meaning of the cone’s geometry. A common error is viewing the widening boundary of the cone as an indication of the physical size and geographic footprint of the storm itself, rather than understanding that the cone represents the statistical uncertainty associated with the storm’s projected track.
"For years, research has shown that people often mistake a wider cone for a bigger storm," Ray said. "Our findings suggest that even with an updated graphic, that misconception can be hard to shake."
This deeply ingrained misunderstanding contributes to the broader challenge of risk perception during severe weather events. When residents misinterpret graphical representations of uncertainty, they may underestimate the intensity of a compact storm or overestimate the dangers posed by the peripheral edges of a weakening system.
Why Better Hurricane Warnings May Not Be Enough
The NHC introduced its expanded forecast graphic in 2024 to address a critical safety communication gap. Traditional maps often left inland residents with a false sense of security, assuming that major hurricane hazards evaporated once a storm moved ashore. By incorporating inland hurricane and tropical storm watches and warnings directly into the forecast cone, the updated graphic aims to provide a more complete picture of where dangerous conditions could develop as a system progresses over land.
Yet, the Florida State University study suggests that simply adding more information to a forecast graphic does not automatically make individuals more aware of their personal risk or more likely to respond appropriately.
The researchers were careful to emphasize that their findings do not call into question the quality or accuracy of the National Hurricane Center’s weather predictions, which they regard as exceptionally precise. Instead, the results highlight the profound difficulty of translating complex meteorological data into visual formats that non-scientists can readily interpret and act upon when making critical safety decisions.
"Our question wasn’t whether the science is good," said co-author Patrick Merle. "The science is excellent. The question is how we communicate that science so people who aren’t meteorologists understand the risk they’re facing."
Merle added that if people find forecast information credible but still fail to grasp its implications well enough to take protective action, the communication process has fallen short of its ultimate objective. The primary goal of any public-facing weather forecast, he noted, is to empower people with actionable information that helps them stay safe.
How to Better Understand Hurricane Risks
Given these insights, the researchers stress the importance of looking beyond a single forecast image when preparing for an approaching hurricane. While the cone of uncertainty offers valuable context regarding a storm’s expected trajectory, it cannot fully communicate every localized hazard that a specific neighborhood or community might experience.
To bridge this gap, the research team recommends that the public utilize hurricane forecast graphics in conjunction with localized weather predictions and detailed impact reports. By seeking out information regarding specific local threats—such as storm surge, flash flooding, wind damage, and evacuation orders—residents can form a more complete basis for decision-making.
"Our findings are a reminder that one graphic can only tell you part of the story," Ray said. "Don’t rely on the cone alone. Pair it with clear, local information about what impacts to expect and what actions to take. That gives you a fuller picture of what the storm could mean where you live and what to do next."
The study was supported by internal funding through a Florida State University SEED grant. The research project also benefited from collaborative discussions with the National Hurricane Center, which supplied the experimental forecast graphics evaluated throughout the study.