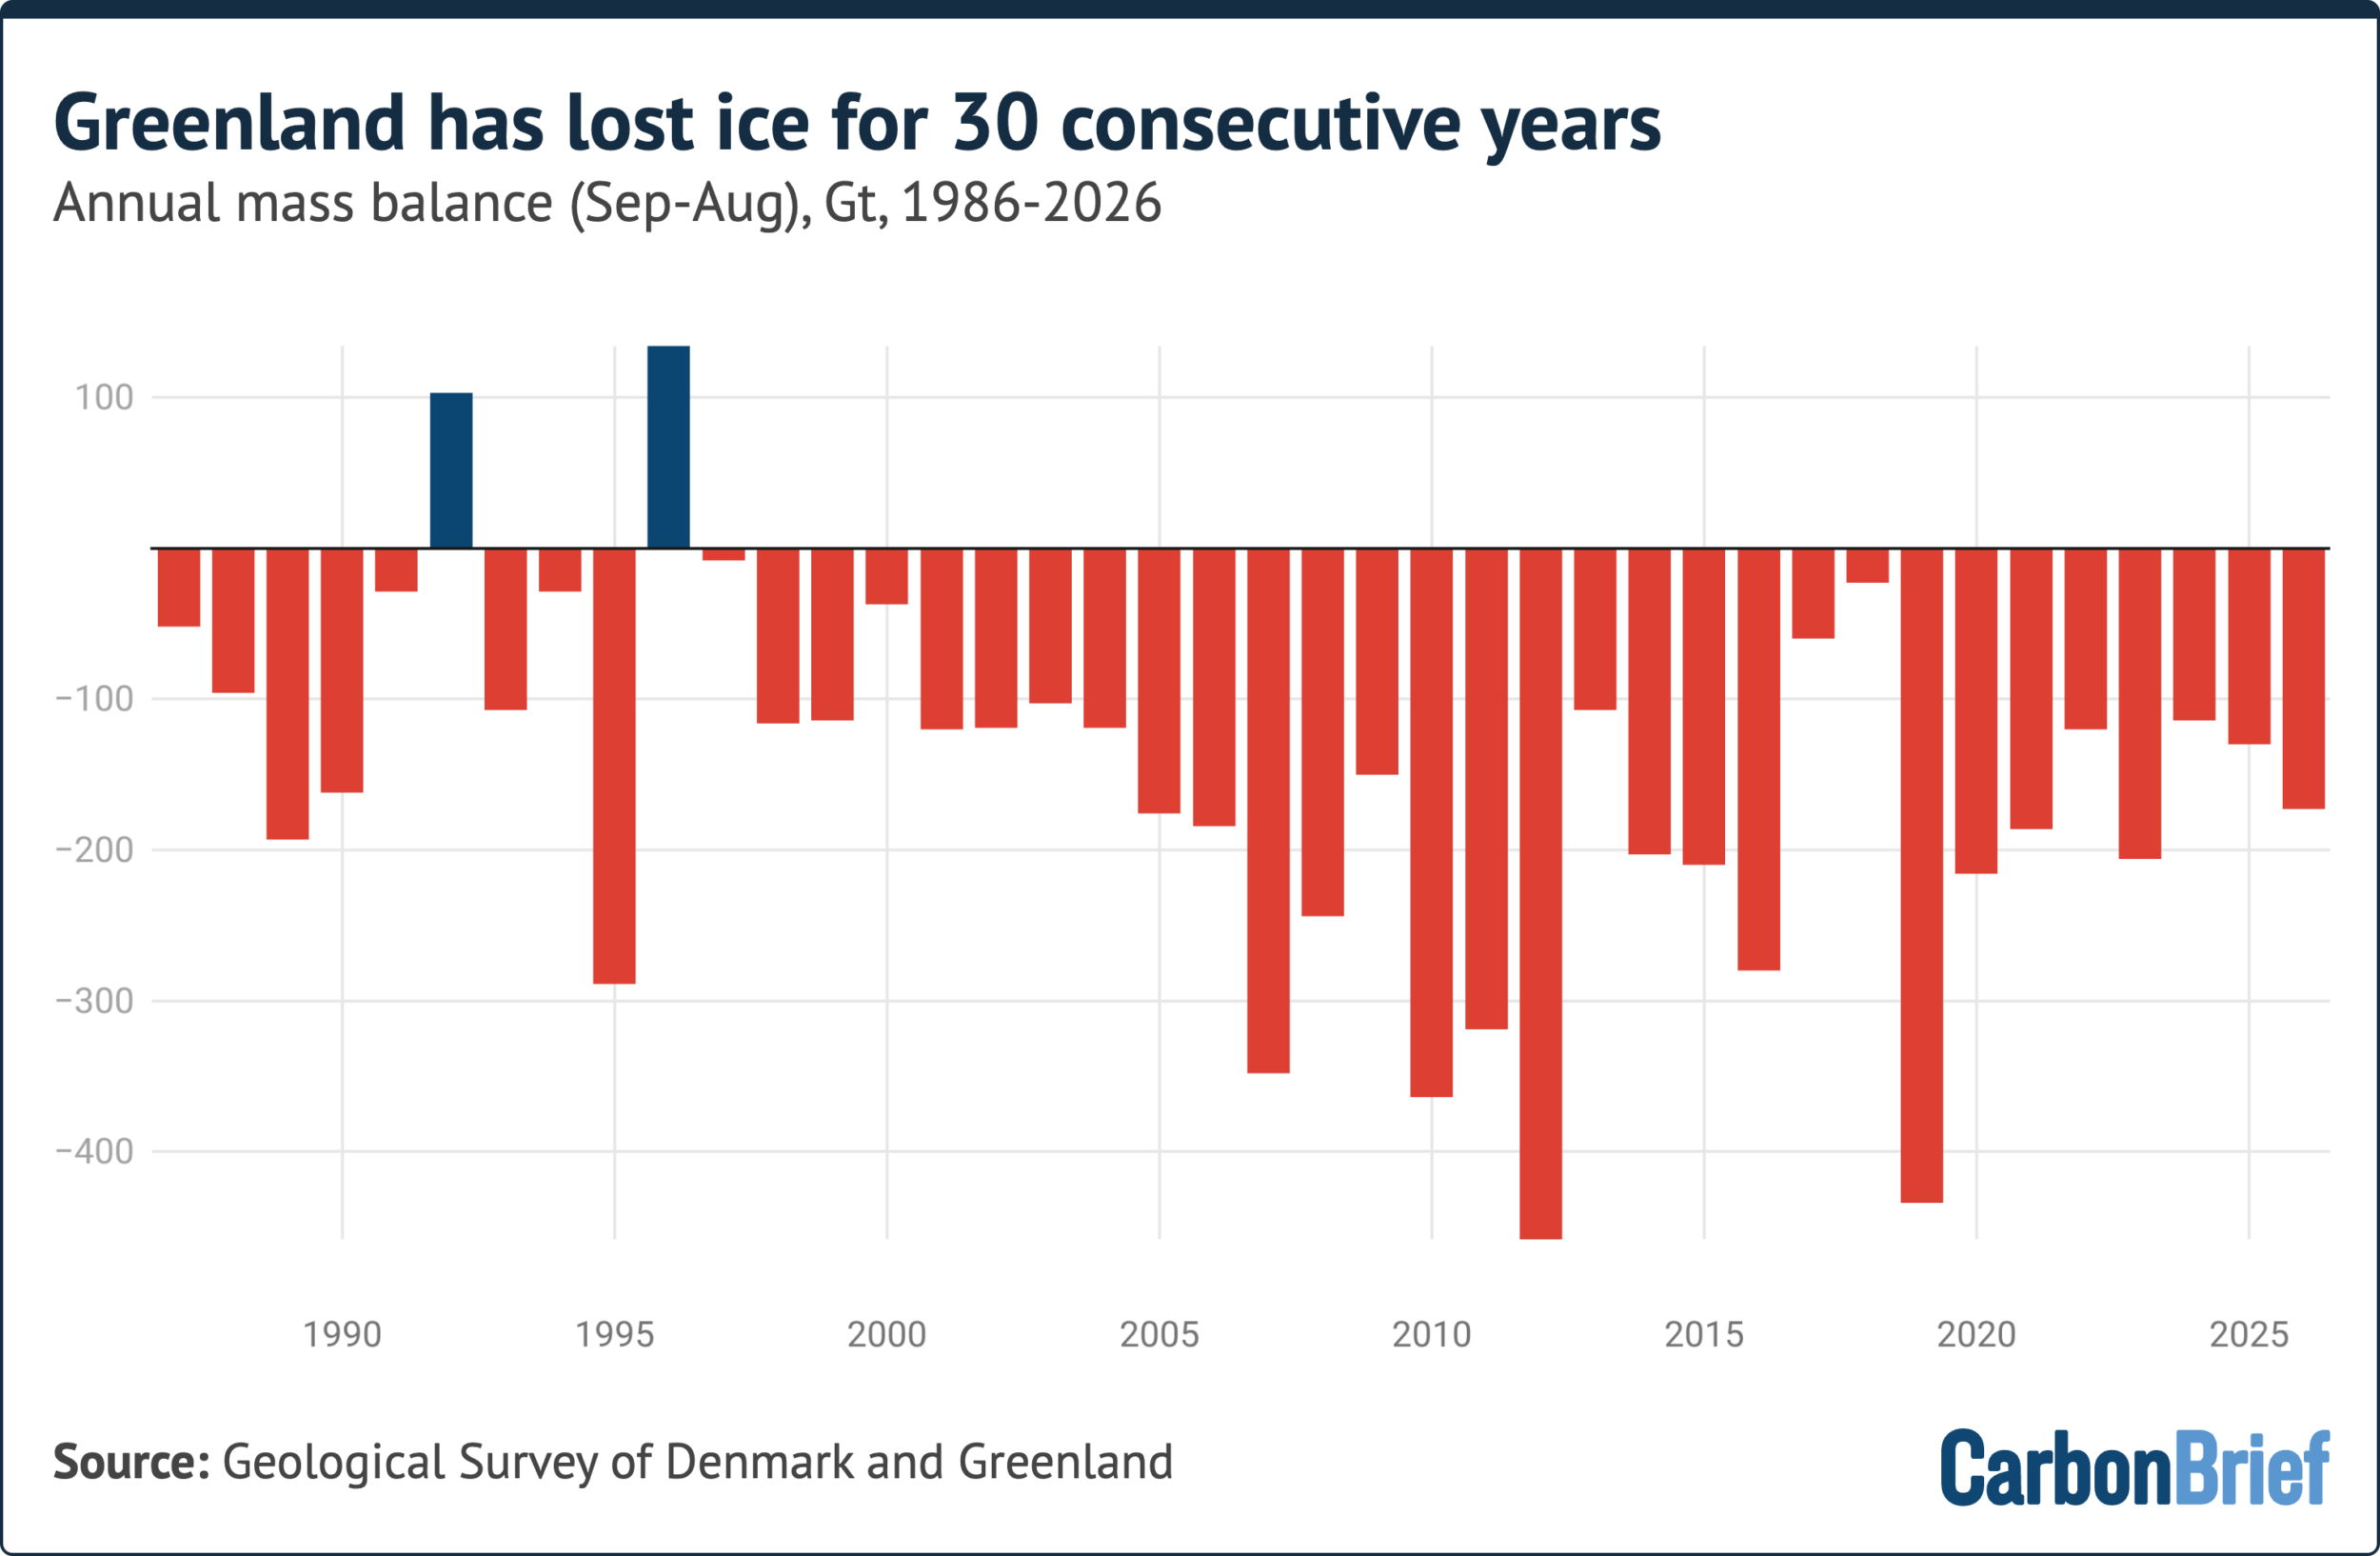
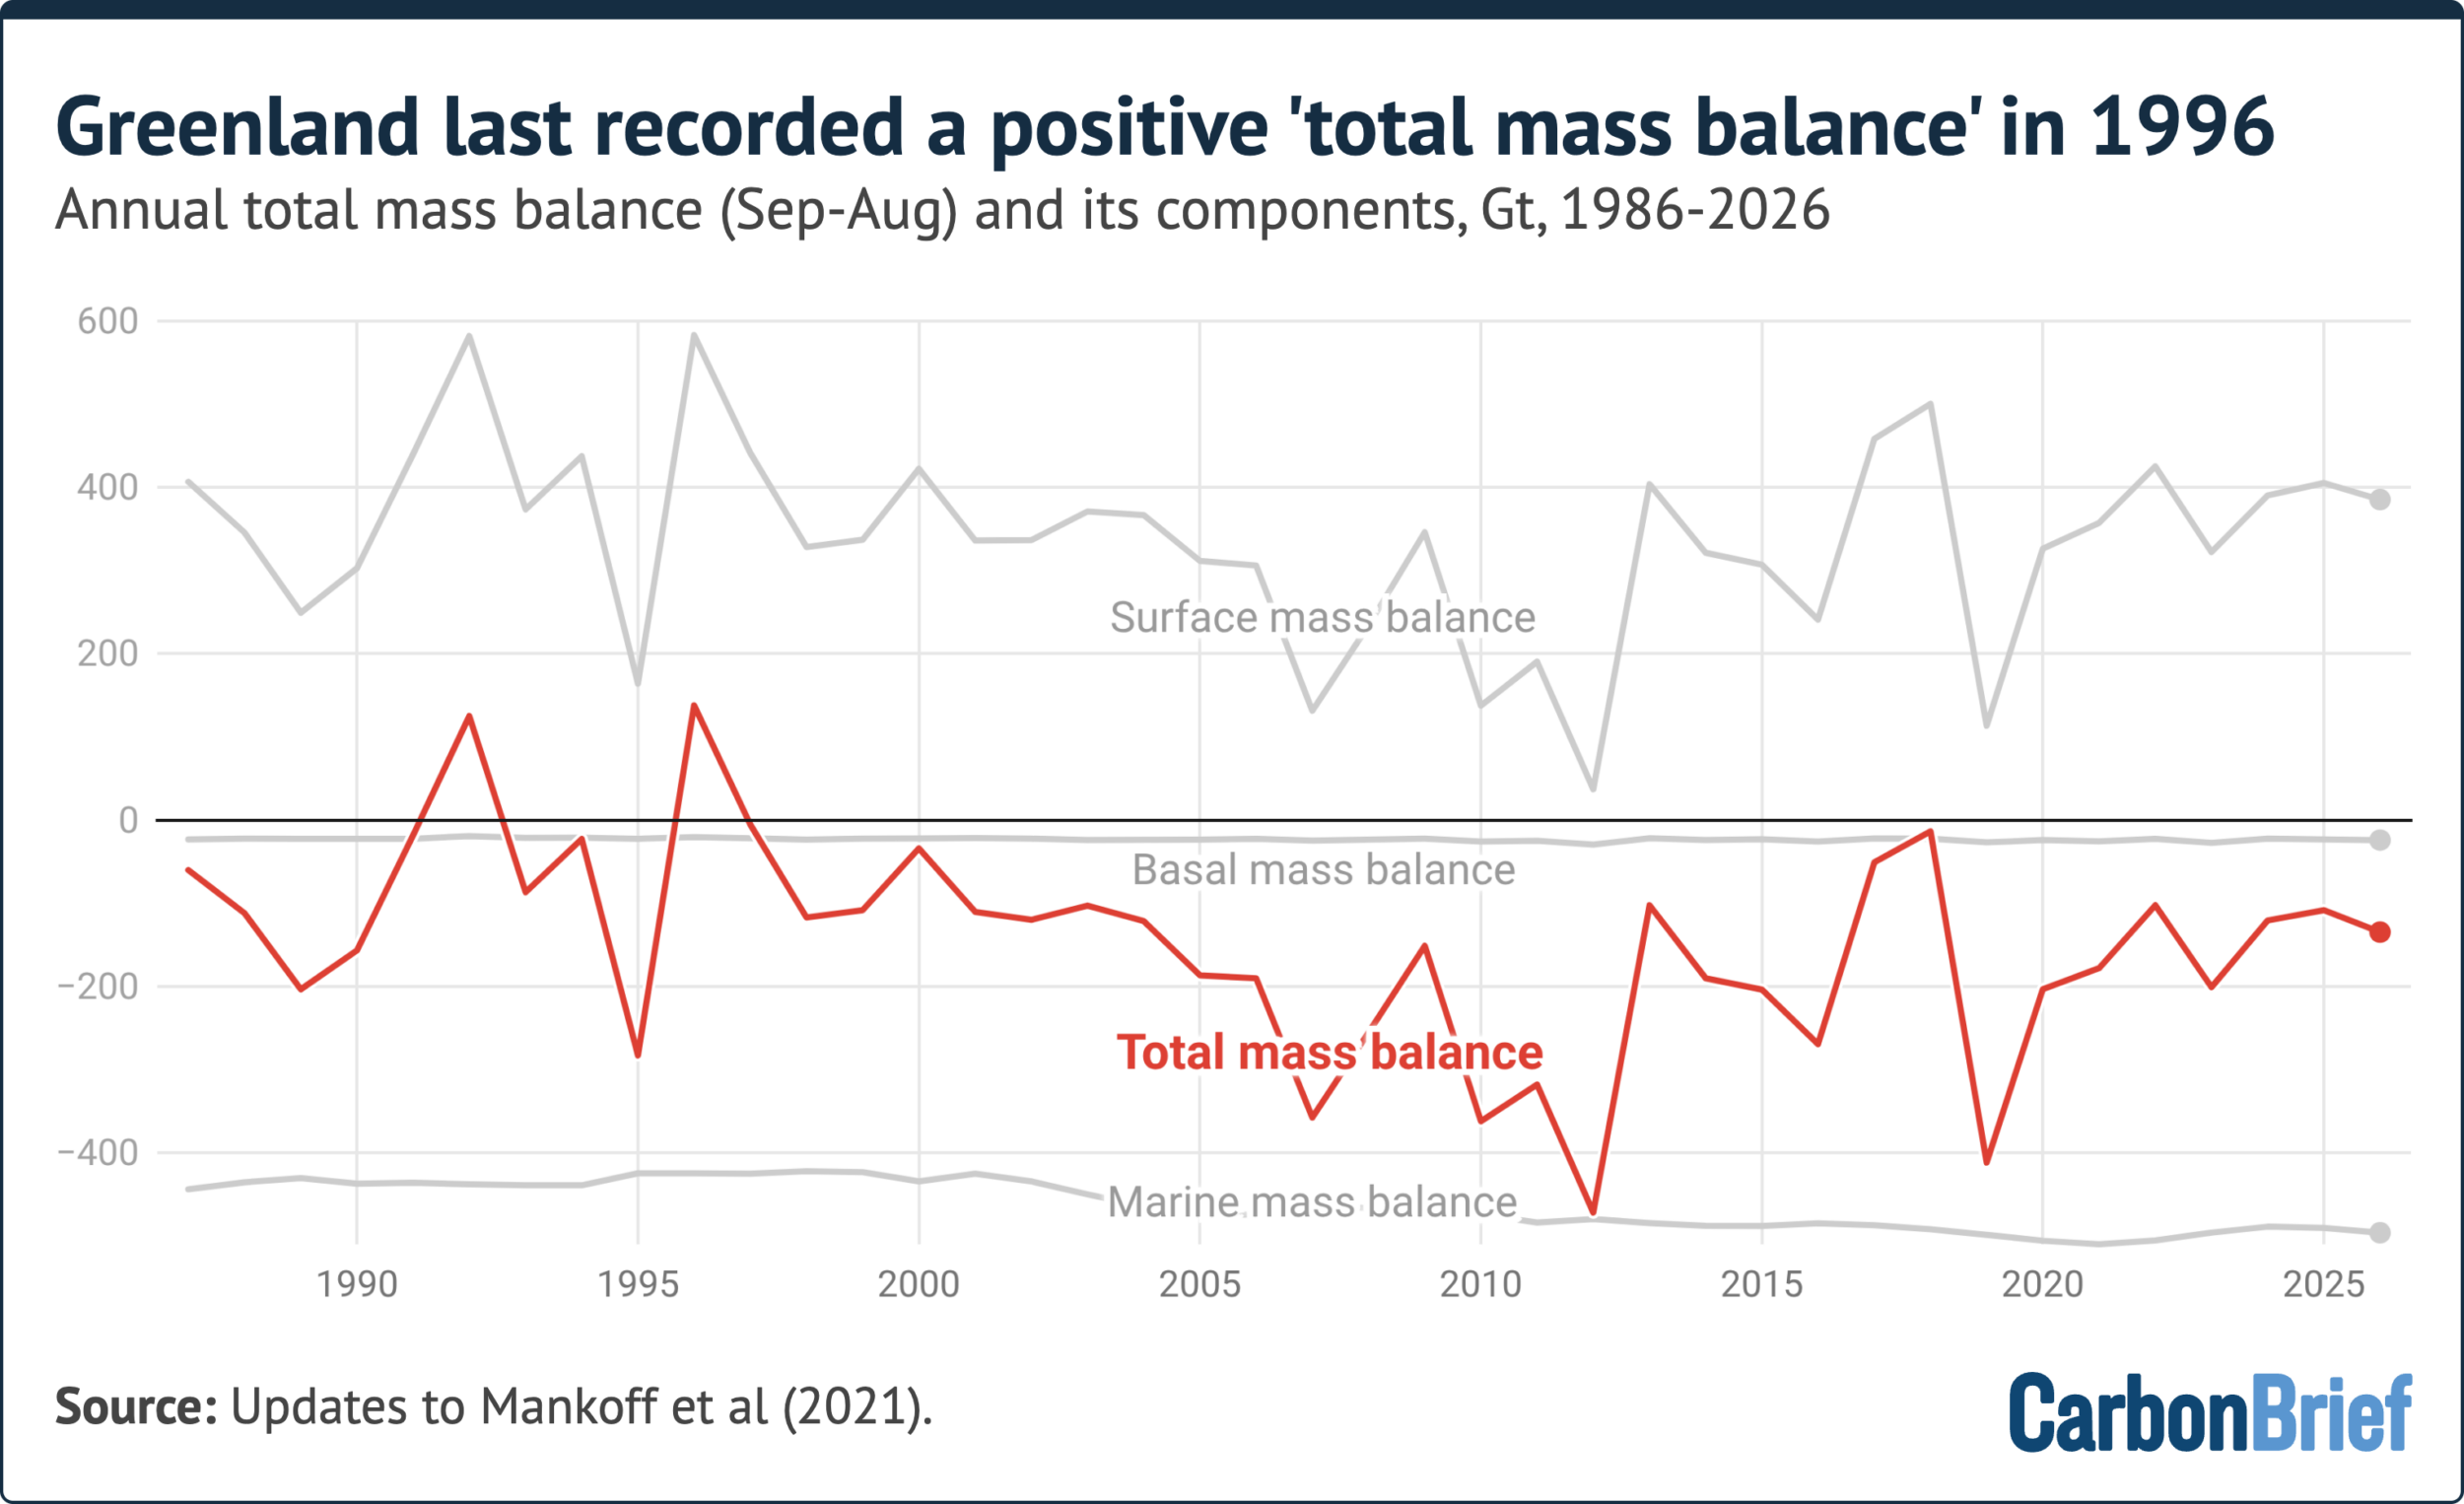
Greenland has officially marked its 30th consecutive year of losing more ice than it gained, a grim milestone that underscores the relentless march of human-induced climate change. Over the 12-month period leading up to August 2026, the world’s second-largest ice sheet shed approximately 135 billion tonnes of ice in total mass balance, confirming that the island’s frozen expanse remains firmly in the red.
What makes this latest annual deficit particularly alarming to the scientific community is that it occurred during a year that lacked extreme weather conditions. The region experienced a relatively cool start to the summer and significantly less surface melting than what has been recorded in previous volatile years. In short, it was not an extraordinary year for Greenland’s weather, yet the ice sheet still suffered massive net losses.
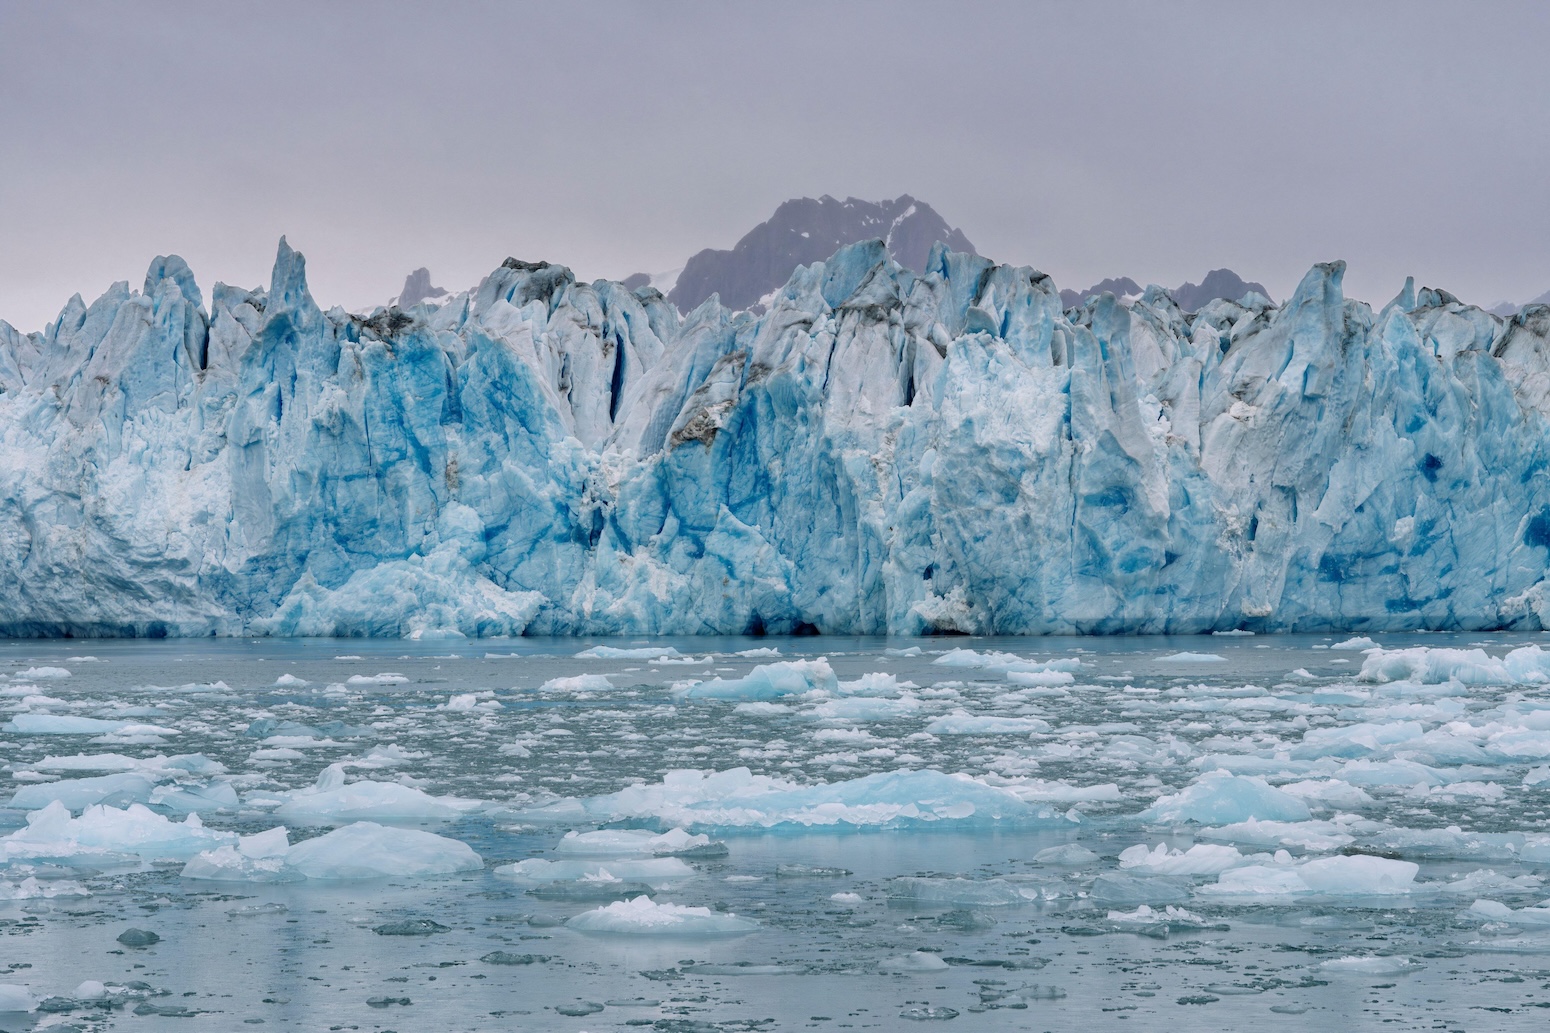
This uninterrupted three-decade decline carries profound scientific significance. Climatologists typically rely on 30-year spans of data to isolate the distinct fingerprint of human-caused climate change from natural, cyclical variations in the global climate system. In Greenland, the direction of travel has been definitively downward every single year since 1996, removing any remaining doubt regarding the long-term trajectory of the region. Furthermore, these updated figures arrive alongside a growing body of research highlighting that the ice-melting processes observed in Greenland for decades are now increasingly being replicated in Antarctica. This convergence suggests that Greenland is not only the largest contemporary contributor to ice-driven sea level rise, but also serves as a critical preview of what lies ahead for the planet’s largest ice sheet.
Understanding Surface Mass Balance
To comprehensively track the health and stability of the Greenland ice sheet, scientists continuously monitor its "surface mass balance." This metric represents the net difference between mass gained through heavy winter snowfall and mass lost due to surface melting during the warmer months of the year.
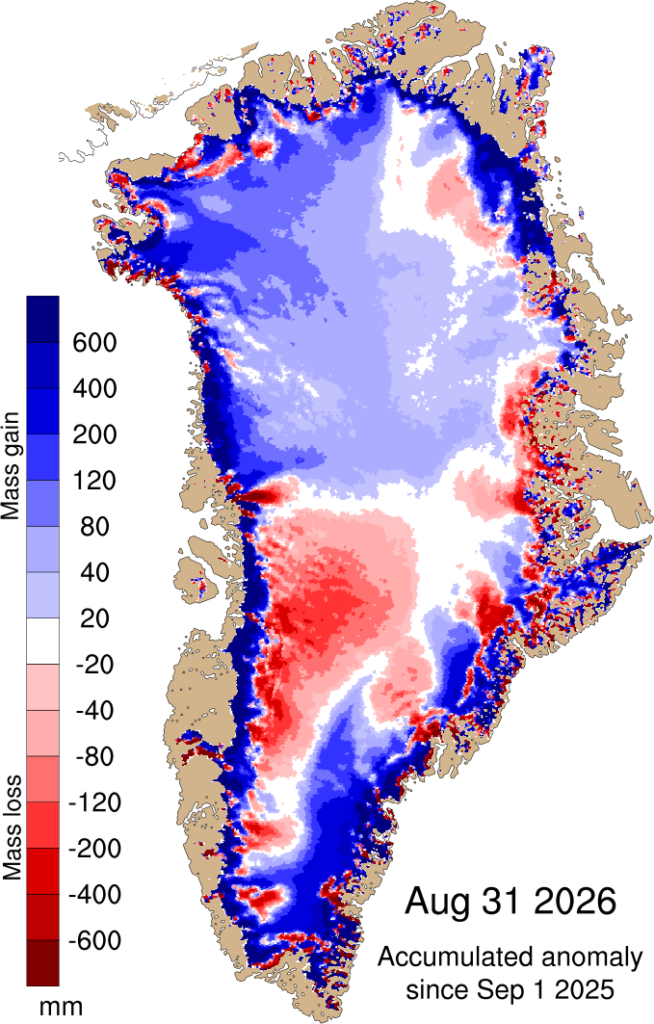
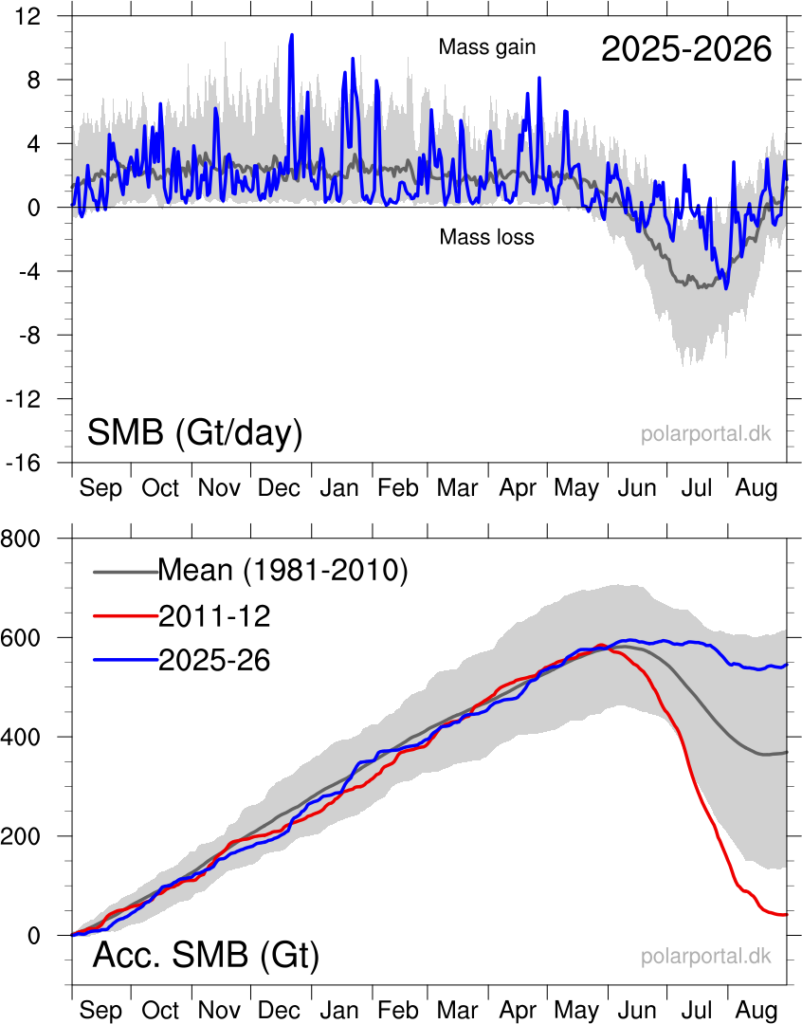
Greenland’s annual ice cycle operates on a fixed schedule, running from the first of September through the end of August. Historically, the surface mass balance at the close of this period has always been positive because cumulative winter snowfall exceeds summer melt. Typically, the ice sheet accumulates mass steadily throughout the colder months of autumn, winter, and spring. Then, as temperatures climb beginning in mid-June, surface melting outpaces accumulation.
For the 2025–26 cycle, Greenland concluded the year with an overall surface mass balance of 519 billion tonnes. This figure stands as the sixth highest in a robust dataset spanning 46 years, sitting roughly 178 billion tonnes above the 1981–2010 historical average of approximately 350 billion tonnes. Daily and cumulative tracking data compiled by the Polar Portal illustrate how the ice sheet steadily accumulated mass from September 2025 through May 2026 before entering its seasonal decline in June.
Evaluating Total Mass Balance
While surface mass balance offers vital insights, researchers also measure the broader health of the ice sheet through its "total mass balance." This comprehensive calculation incorporates surface melting alongside the dynamic processes of iceberg calving and the underwater melting of glacier fronts where they meet warm marine waters, collectively known as marine mass balance. It also accounts for a minor amount of melting occurring at the bedrock floor beneath the ice sheet, referred to as basal mass balance.
When all these factors are aggregated, Greenland’s total mass balance at the end of the annual cycle has remained stubbornly negative for decades. The 12 months leading to August 2026 followed this established pattern. Utilizing the standard methodology based on an average of three climate models, researchers calculated that Greenland lost approximately 135 billion tonnes of ice.
However, for the first time, this year’s assessment incorporates a secondary, independent estimate for Greenland ice loss. This alternative approach—drawing from a single climate model combined with data from automatic weather stations, satellites, GPS tracking, and aerial observations—suggests an even higher loss of 173 billion tonnes over the 2025–26 period. Scientific estimates vary due to inherent complexities regarding incomplete data on ice thickness, flow velocity, and surface melt rates, prompting researchers to apply diverse methodologies to account for these uncertainties. Regardless of the specific model used, the overarching conclusion remains unchanged: 2025–26 marks the thirtieth consecutive year of net ice loss, with 1996 standing as the last year to record an annual net gain.
The Dynamics of Surface Melt
The peculiarities of the 2025–26 ice cycle were heavily influenced by regional weather anomalies. The winter and early spring seasons were unusually dry across the southern half of Greenland, leaving the ice sheet with roughly 40 billion tonnes less snow accumulation than normal. Typically, dry winters portend severe ice melt later in the year, as heavy winter snowfall normally provides a thick, reflective shield that protects the underlying ice during the early stages of summer.
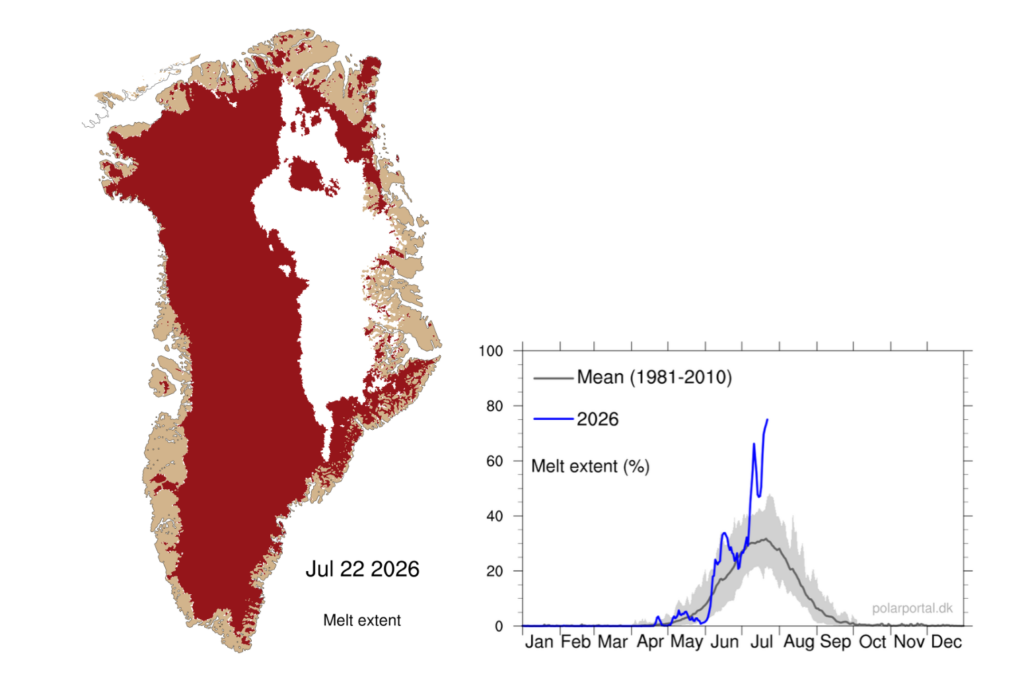
Despite the lack of a protective snow buffer, the onset of summer offered a temporary reprieve. A relatively cool start to the season, characterized by frequent snowfall and dense cloud cover, severely limited the sun’s ability to warm the surface during the weeks when solar radiation is normally at its peak. The official melt season—defined as the first instance of at least three consecutive days featuring surface melting over more than 5% of the ice sheet—did not begin until June 5, arriving nine days later than the 1981–2010 average.
Weather patterns shifted dramatically at the end of June as warm, high-pressure conditions took hold. For the first twenty days of July, surface melting soared well above the historical average. At its seasonal peak on July 22, active surface melt spanned 74.9% of the entire ice sheet. While this was notably lower than the record-breaking July 2025 melt area—which saw 81.2% of the ice sheet melting simultaneously—it demonstrated the potent capacity for rapid summer degradation. Fortunately, the fresh snow that fell during the cooler early weeks of June helped form a bright, cold buffer that successfully mitigated the severity of subsequent runoff.
Snowfall and Glacier Calving
Snowfall remains the singular mechanism by which the Greenland ice sheet can replenish its mass. Although the winter of 2025–26 was remarkably dry in the south, much of the summer melt water managed to trickle down into the underlying snow layers and refreeze rather than running off into the ocean. Furthermore, while the south-east remained the wettest sector of the ice sheet, unusual amounts of summer snowfall were also recorded along the west coast north of Nuussuaq. Fresh summer snow plays a critical protective role because its bright surface reflects significantly more solar energy back into space than exposed, darker glacier ice.
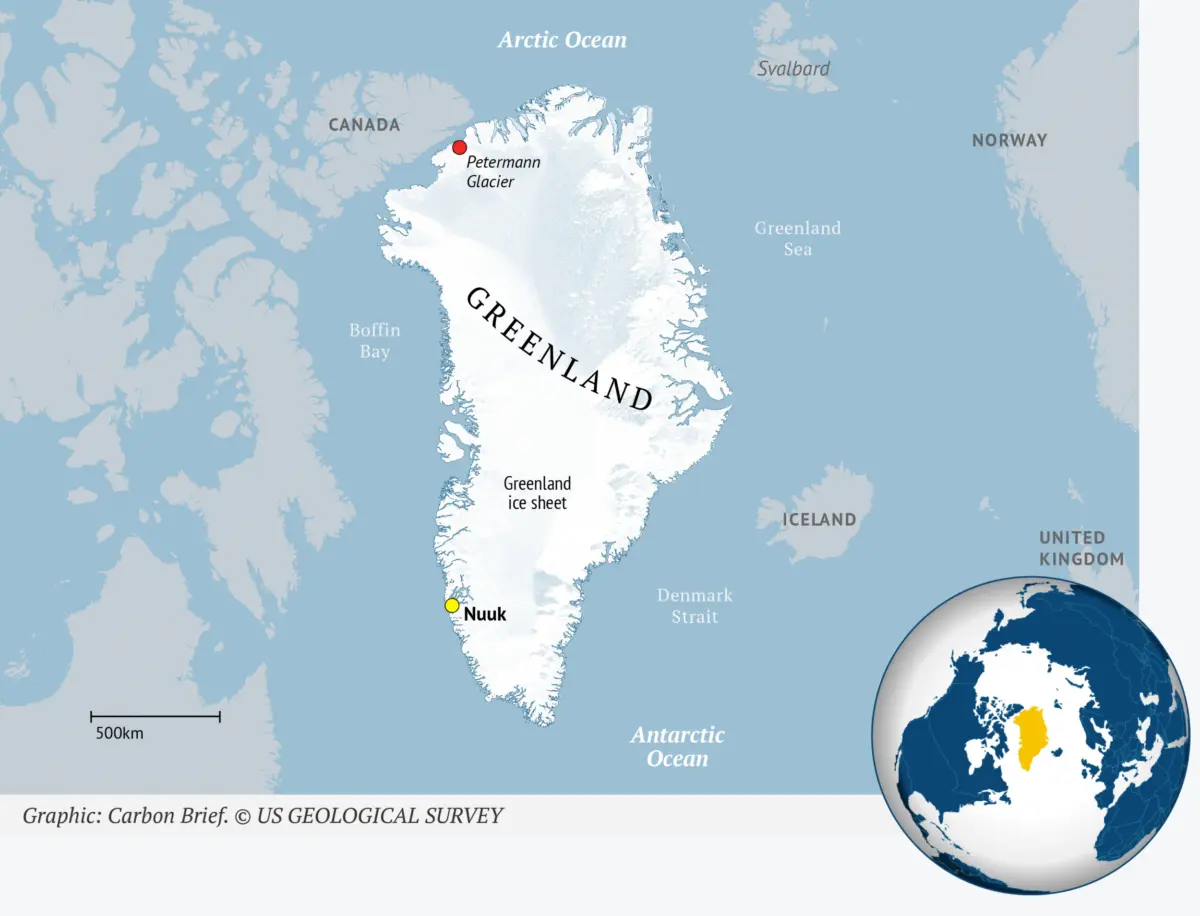
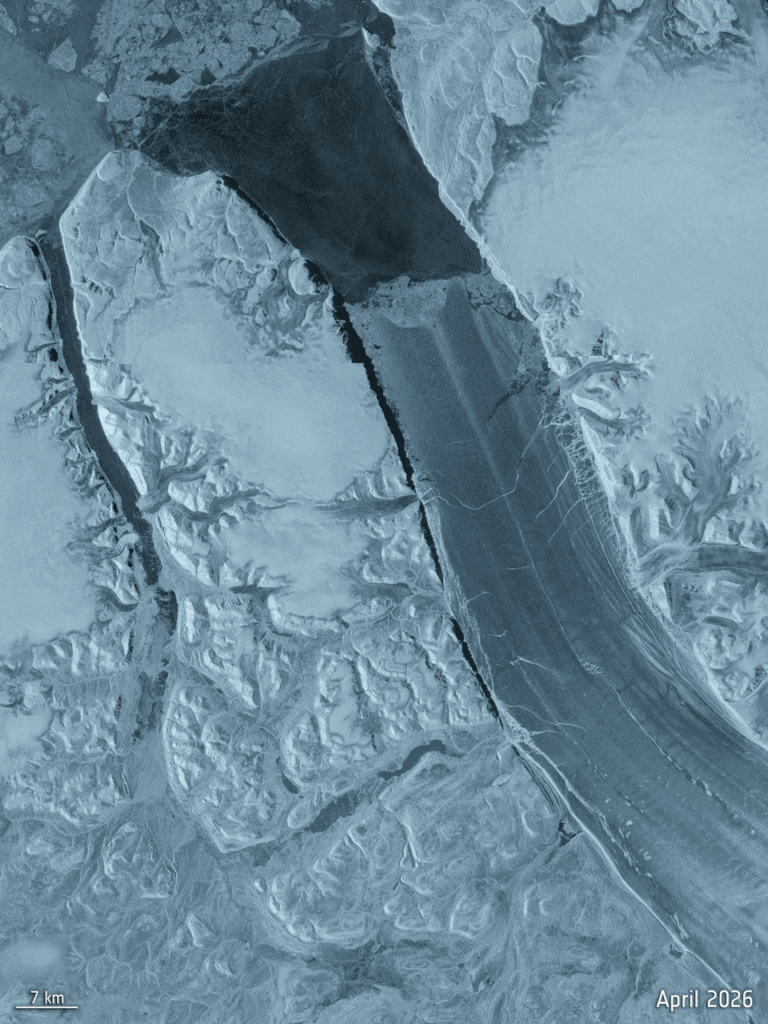
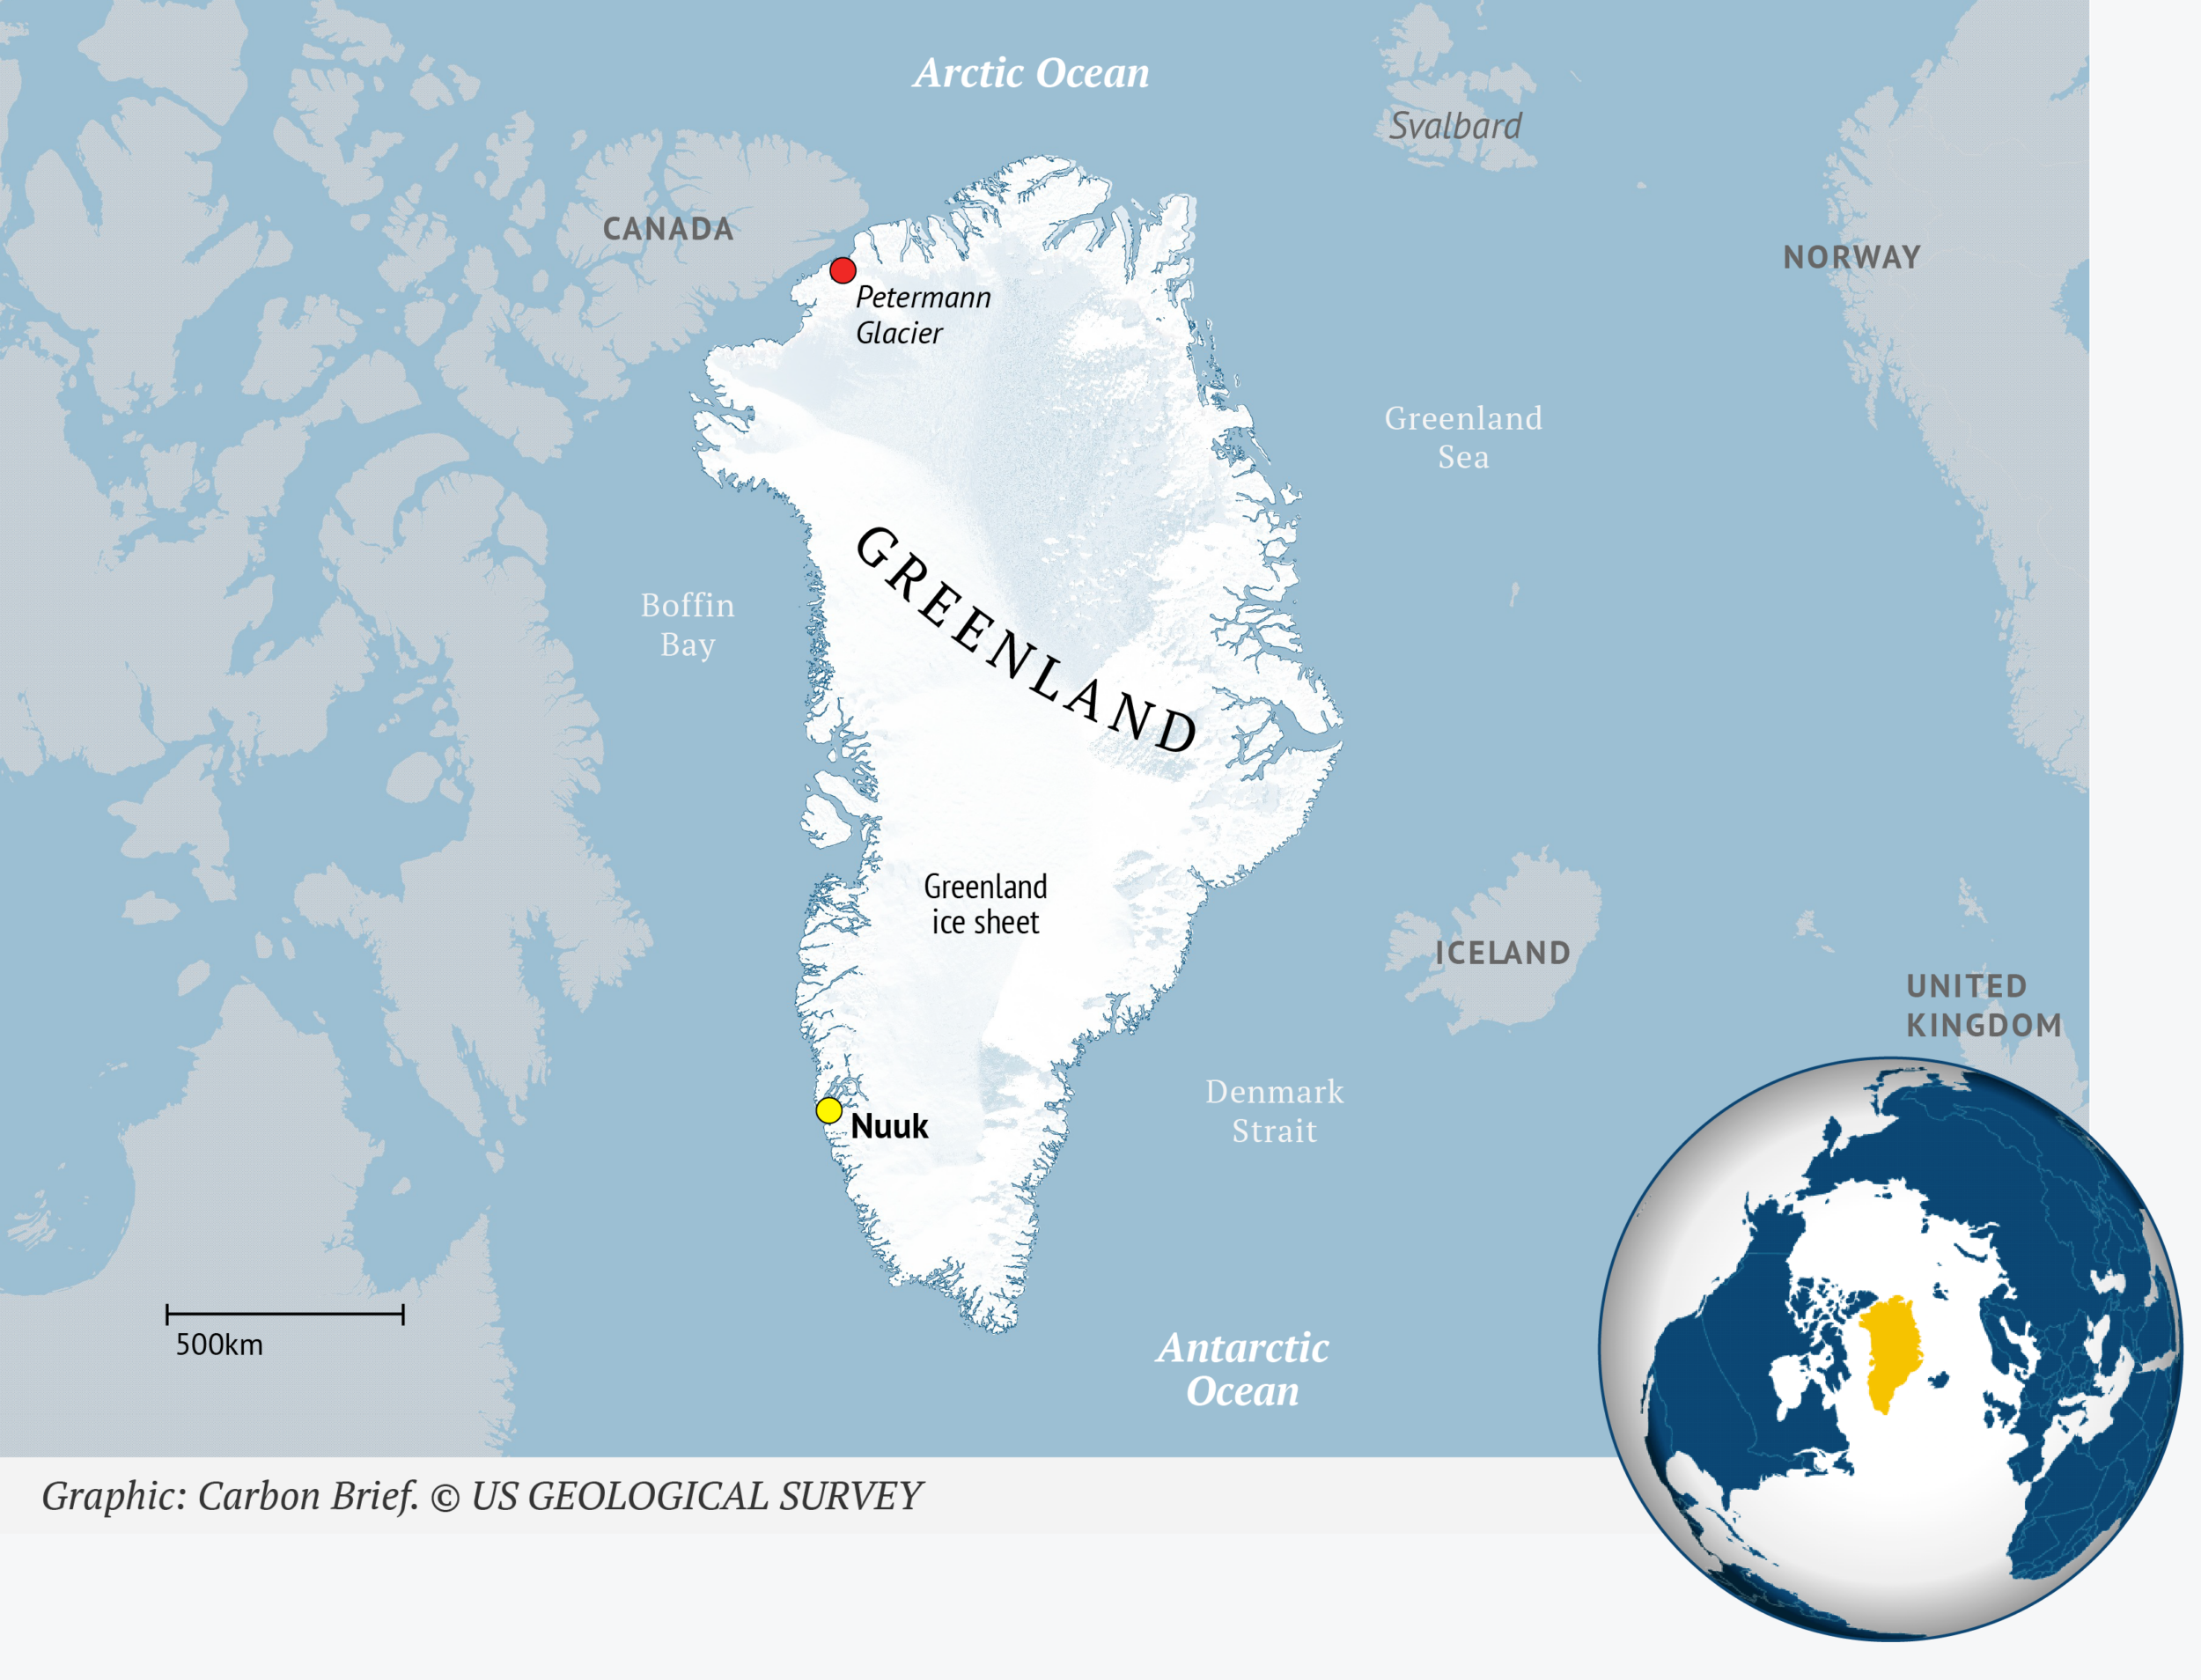
The most visually dramatic ice loss of the year, however, occurred at the margins of the ice sheet. On August 4, a massive tabular iceberg—an expansive ice island characterized by vertical sides and a flat top—broke away from the floating ice tongue of the Petermann Glacier in north-west Greenland. Spanning more than 76 square kilometers and measuring an estimated 150 meters in thickness, the sheer volume of frozen water contained within this single iceberg is equivalent to enough water to submerge the entirety of greater London to a depth of 6.65 meters.
This catastrophic calving event represents the largest loss of floating ice at the Petermann Glacier since 2012 and the most significant breakoff by any Arctic glacier since 2020. The event had been anticipated by glaciologists for years due to widening rifts across the ice tongue. Scientists warn that further major breakoffs are imminent, with two additional ice islands expected to detach as existing fractures propagate further across the tongue. Combined, these impending detachments will remove roughly 22% of Petermann’s remaining floating ice.
Because this ice tongue was already floating on the ocean, its detachment does not directly raise global sea levels. However, the Petermann Glacier serves as one of Greenland’s vital marine-terminating outlets, acting as a structural brake on the relentless flow of ice from the continental interior toward the sea. This major calving event underscores the reality that glacier retreat continues at a rapid pace regardless of whether surface mass budgets appear moderate in any given year. Historically, calving and glacier retreat have accounted for roughly two-thirds of total ice loss across the continent.
Global Weather Patterns and the Omega Block
The relatively favorable surface mass balance observed in Greenland during the 2025–26 cycle can be partially attributed to extreme weather phenomena unfolding thousands of miles away. Throughout the summer of 2026, severe and repeated heatwaves gripped southern Europe and North America, shattering long-standing temperature records across multiple countries.
These sustained heatwaves were driven by atmospheric blocking patterns, wherein high-pressure systems become immobilized in place, forcing the high-altitude jet stream to buckle into a shape resembling the Greek capital letter Omega. Under this recurring weather configuration, intense warmth settles beneath the core of the high-pressure system, while cool and wet conditions prevail at the outer edges, commonly referred to as the feet of the Omega pattern.
For the duration of the summer, Greenland fortuitously positioned itself beneath the cooler, wetter flank of the Omega-shaped jet stream, sparing the region from the scorching temperatures that would have triggered unprecedented surface melting. Had this atmospheric blocking pattern shifted by even a fraction of its wavelength, Greenland would likely have experienced baking heat, catastrophic melt rates, and a severely depleted surface mass balance.
Three Decades of Uninterrupted Decline
The milestone of thirty consecutive years of net ice loss carries immense scientific weight. A single anomalous year, regardless of how dramatic its weather events might be, is heavily susceptible to short-term meteorological fluctuations. An exceptionally warm summer or an unusually snowy winter reveals little on its own about the broader, structural health of a polar region. This is precisely why climatologists evaluate climate trends over rigorous thirty-year windows to differentiate genuine systemic shifts from natural variability.
Spanning three decades of empirical data, the record shows that Greenland’s annual ice budget has closed in the red every single year since 1996, persisting through warm years, cold years, and heavy snowfall years alike. While the single-year record for absolute mass loss remains pinned to 2012—when an estimated 458 billion tonnes of ice vanished—recent years continue to register losses exceeding 100 billion tonnes annually even during comparatively quiet meteorological cycles. Thirty consecutive years of sustained decline provide researchers with the empirical certainty required to state unequivocally that Greenland’s ongoing ice loss is directly driven by anthropogenic climate change.
Greenland and Global Sea Level Rise
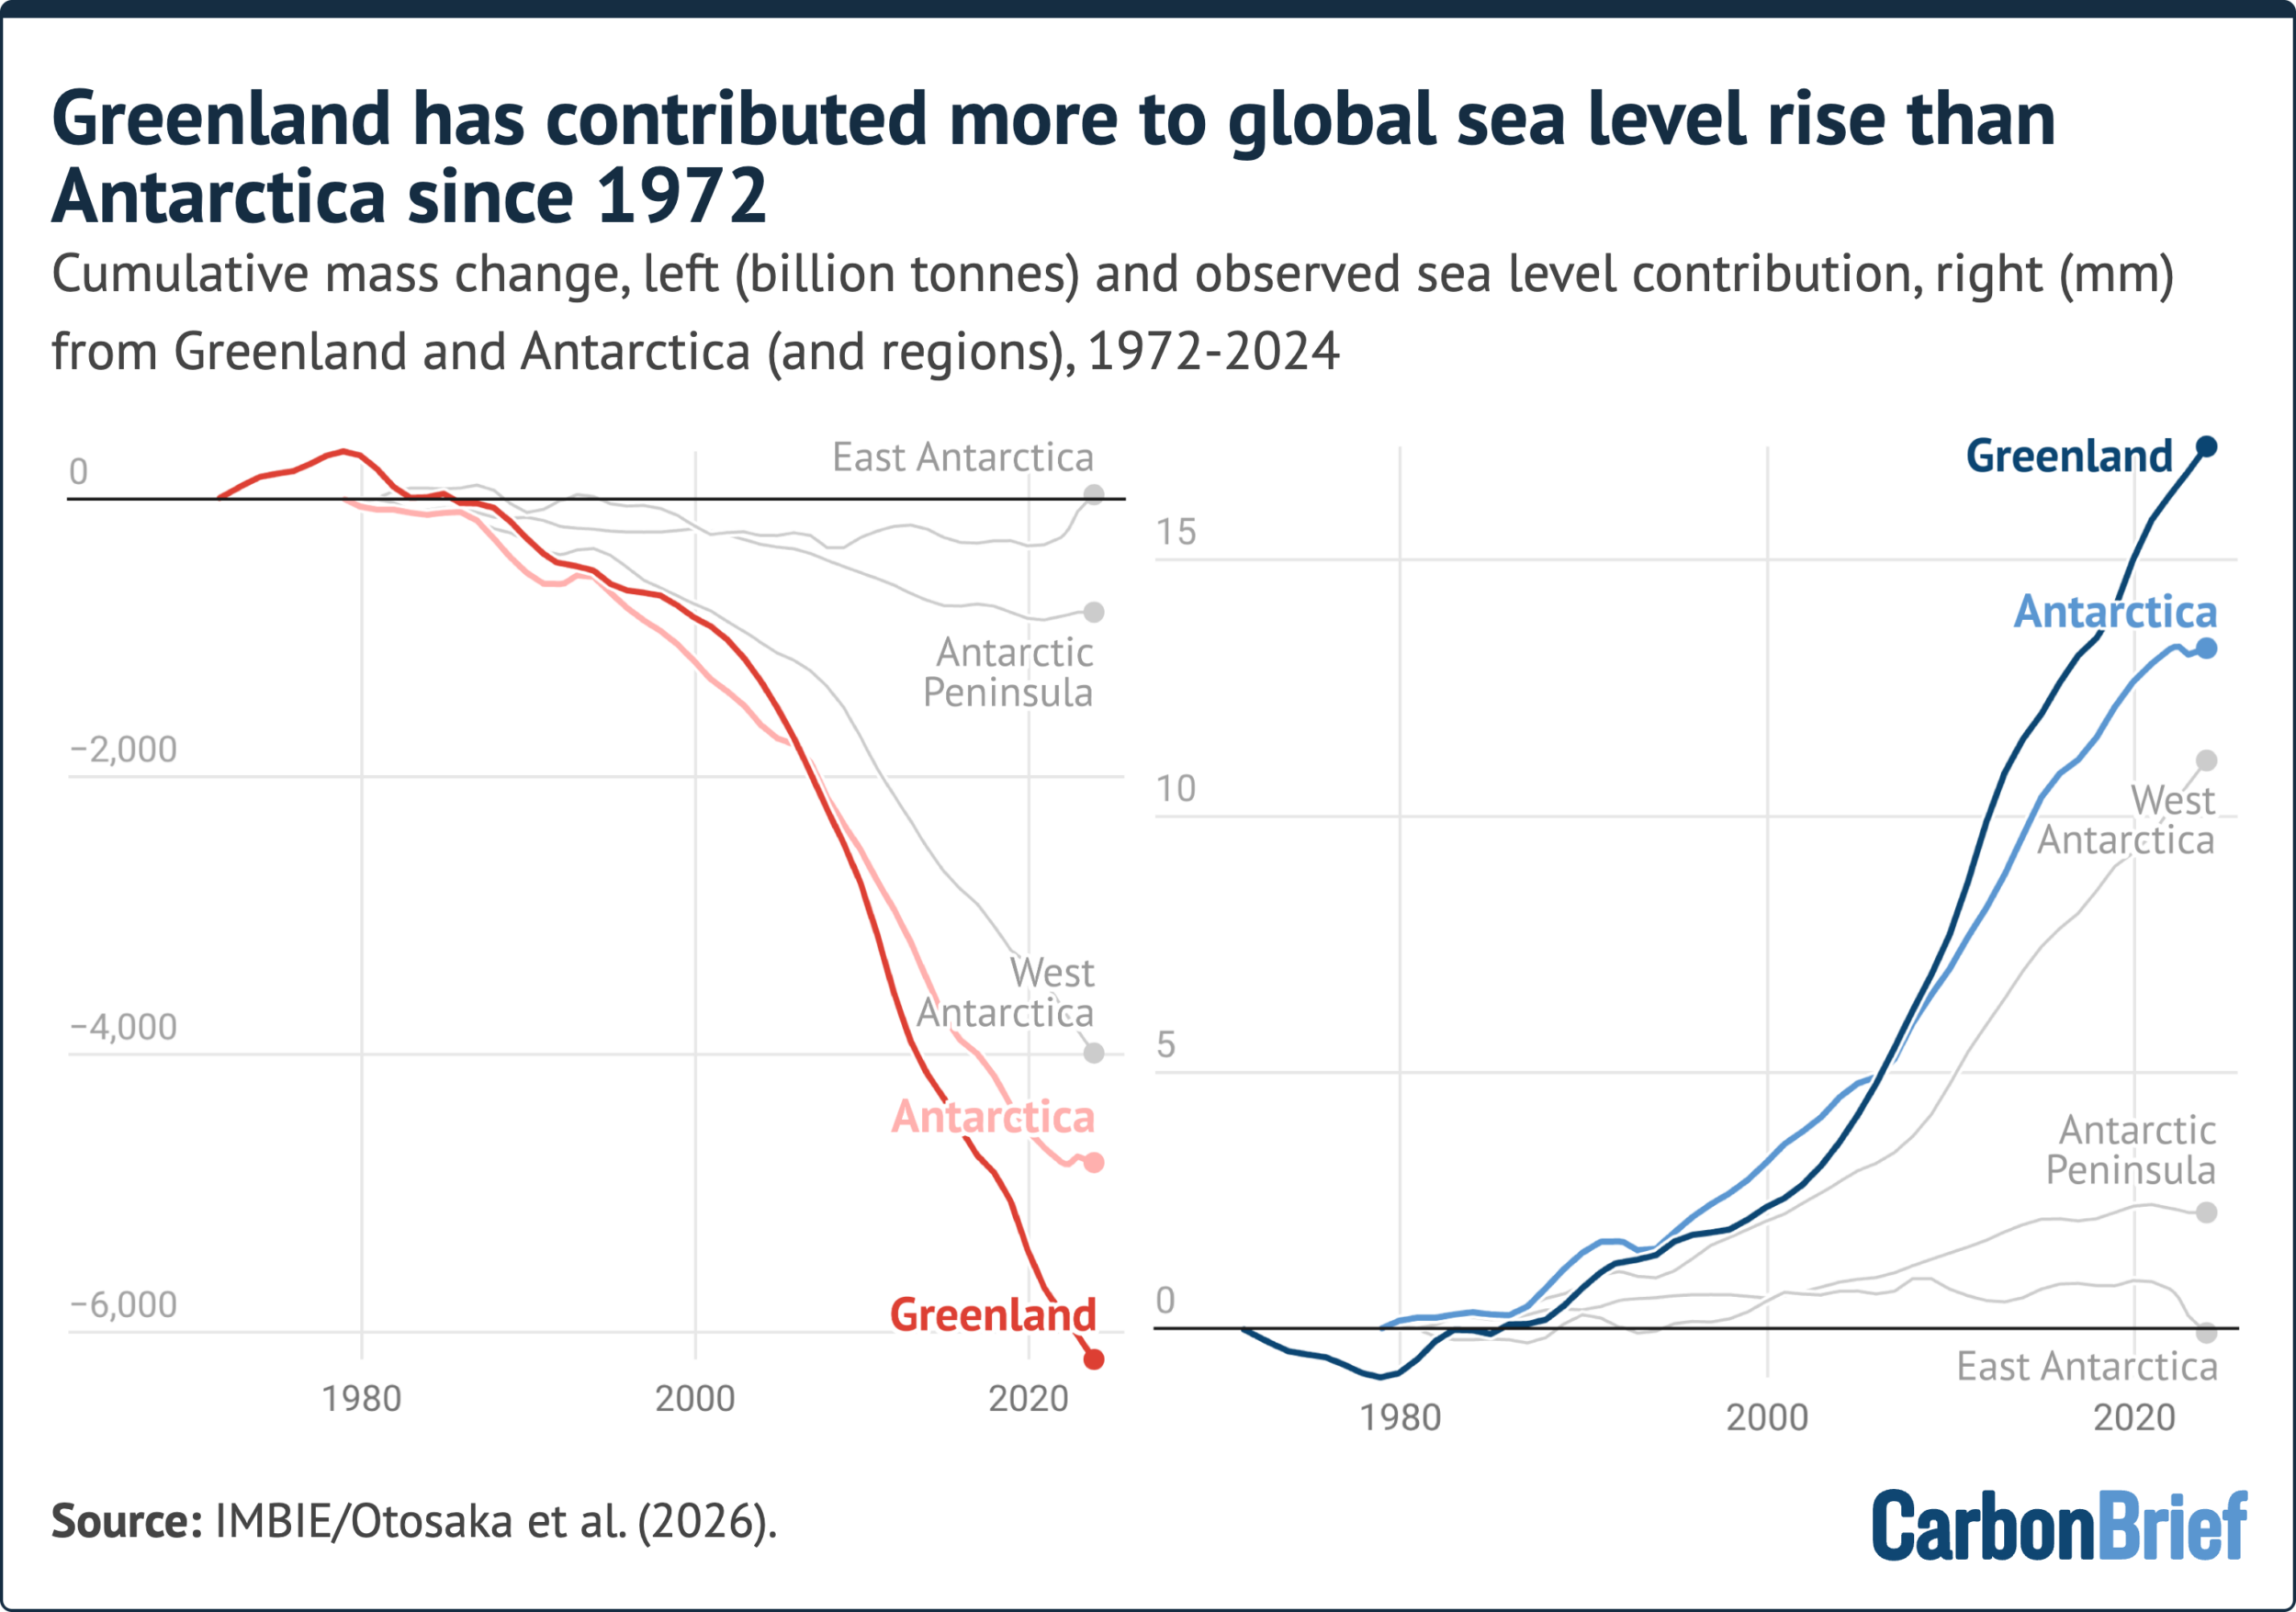
A comprehensive new assessment highlights the central role that Greenland plays in driving global sea level rise. The Ice Sheet Mass Balance Intercomparison Exercise (IMBIE), which aggregates 42 independent estimates of polar ice mass change derived from satellite gravimetry, altimetry, and input-output calculations, published its latest findings in the journal Scientific Data.
The data reveals that between 1979 and 2023, the combined ice sheets of Greenland and Antarctica shed an astonishing 11,309 billion tonnes of ice, pushing global sea levels up by approximately 32 millimeters. Together, these two polar giants now account for nearly a quarter of all observed global sea level rise.
Greenland has been the dominant force in this historic ledger, losing 6,215 billion tonnes of ice between 1972 and 2023, which translates to an average annual loss of 119 billion tonnes. Two-thirds of Greenland’s total loss over this period was driven by increased ice discharge into the oceans, while the remaining third resulted from diminished surface mass balance caused by enhanced melting. Annual losses tied explicitly to surface melt accelerated dramatically, rising from roughly 60 billion tonnes per year in the 1980s to an average of 264 billion tonnes per year throughout the 2010s.
By comparison, Antarctica lost 4,780 billion tonnes over the same multi-decade timeframe, contributing approximately 13 millimeters to global sea level rise. Notably, nearly all of Antarctica’s losses stem from dynamic ice discharge concentrated in the western sector of the continent, while East Antarctica has remained relatively stable, with record-breaking snowfall in recent years yielding modest mass gains.
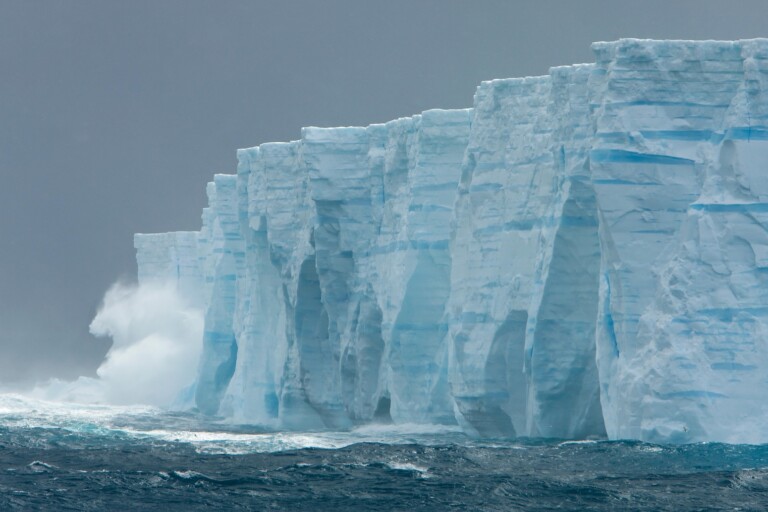
This current division of sea-level contributions is projected to shift over the coming centuries. While Greenland’s cumulative losses to date account for only a few centimeters of global sea level rise, the Antarctic ice sheet is roughly ten times larger and possesses the potential to drive catastrophic increases in future sea levels. The IMBIE assessment emphasizes that Antarctic losses are heavily dominated by marine-terminating glaciers whose structural stability remains exceptionally difficult to model and predict.
Crucially, the physical processes now being observed with increasing frequency across Antarctica—such as accelerated surface melting, diminishing sea ice, the disintegration of floating ice shelves, and the seasonal retreat of outlet glaciers—are phenomena that scientists have documented in Greenland for decades. This emerging reality has prompted researchers to describe the transformation unfolding in the southern hemisphere as the "Greenlandification" of Antarctica. Consequently, Greenland stands not only as the foremost contemporary source of ice-driven sea level rise, but also as a profound and urgent preview of what awaits the planet’s vast southern ice sheet.