In an era defined by an overwhelming influx of information, the ability to collect, visualize, and interpret data has transitioned from a specialized corporate skill to a fundamental life competency. While these analytical proficiencies are typically reserved for higher education or professional boardrooms, a dedicated educational initiative is proving that critical thinking and clear communication are skills that simply do not need to wait until adulthood.
In under two years, the team behind the acclaimed storytelling with data (SWD) organization has successfully reached more than fifteen thousand elementary school students across nineteen United States states and eight countries. Through their engaging children’s book and associated outreach programs, titled Daphne Draws Data, young learners are discovering how to transform raw numbers into compelling visual narratives, building lifelong confidence in their analytical abilities along the way.
Helping people make sense of information and present it effectively is at the heart of what the SWD community does for business professionals and analysts worldwide. However, extending that core mission to children has cultivated a uniquely passionate movement. As the Education and Outreach Specialist for storytelling with data, I have had the profound privilege of helping bring this work to light, witnessing firsthand how naturally children grasp the fundamentals of data literacy when the concepts are presented through relatable, creative storytelling.
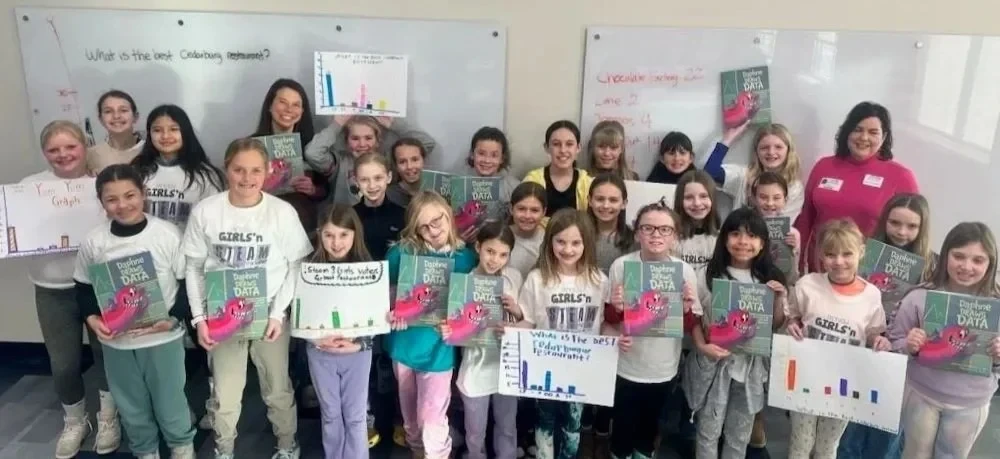
When the initiative was first conceived, the goal was to demystify data for young minds, bridging the gap between abstract mathematical concepts and the tangible stories numbers can tell. Since the initial publication of Daphne Draws Data, the initiative has expanded rapidly, growing from a simple literary project into a multifaceted educational outreach campaign. By partnering with a diverse network of nonprofits, after-school organizations, local libraries, community museums, and STEM-focused education groups, the initiative has successfully created hands-on graphing experiences tailored specifically for young learners.
These interactive programs are designed to take children through the complete data lifecycle. Students learn how to formulate questions, collect their own real-world data, manually draw graphs to represent their findings, and interpret what their discoveries actually mean in the context of the world around them. This active participation ensures that data collection feels less like a tedious academic chore and more like a fun, investigative journey of discovery.
To support continued learning beyond these structured classroom and community programs, the organization has made a concerted effort to place resources directly into the hands of children who need them most. To date, nearly 9,000 copies of Daphne Draws Data have been generously donated to underserved communities and Title I schools, ensuring that socioeconomic barriers do not prevent curious minds from accessing foundational analytical tools. Educators, school administrators, and community leaders interested in learning more about these ongoing programs or inquiring about book donations can reach out directly via email to [email protected].
Crucially, the impact of these educational efforts has extended far beyond the student demographic, creating a ripple effect that touches the adults guiding them. One of the most rewarding and unexpected outcomes has been watching educators, nonprofit leaders, program coordinators, and parents absorb and apply the exact same core data storytelling lessons that SWD typically teaches to corporate professionals.
Adults participating in or observing the programs quickly learn the importance of choosing an appropriate graph type, methodically removing chart clutter to improve legibility, intentionally focusing audience attention where it matters most, and effectively communicating complex ideas through narrative structure. For nonprofit leaders and educators, mastering these communication techniques yields practical benefits that extend well beyond the classroom. These essential skills empower them to clearly advocate for vital funding, secure necessary educational resources, and definitively demonstrate the tangible impact of their community work to stakeholders and donors alike.
Building upon the success of the books and hands-on graphing workshops, this year marked a significant milestone with the official launch of the interactive Daphne Draws Data exhibit. Moving beyond static pages and temporary workshops, this immersive installation allows children to actively contribute their own data points in real time. As visitors interact with the exhibit, they can instantly compare their personal responses with those of their peers, seeing firsthand how their individual input dynamically becomes part of a much larger, collective story.
The physical exhibit is currently hosted at the Kansas Children’s Discovery Center, where it has engaged countless young visitors and sparked lively discussions among families. Organizers have high hopes to expand the exhibition footprint in the near future, bringing the interactive experience to additional children’s museums, science centers, and public learning spaces across the country.
Another major driver behind the exponential expansion of the initiative’s reach has been the tireless dedication of enthusiastic Data Detective leaders. These passionate community volunteers take the initiative upon themselves to bring the graphing with Daphne programs directly to their local neighborhoods, schools, and community centers. Utilizing comprehensive, pre-developed program resources provided by the main organization, these volunteers empower kids to answer their own curious questions by systematically collecting data and drawing visual representations of the answers.
The growth of the Daphne Draws Data initiative demonstrates a widespread, latent appetite for early data literacy education. By transforming numbers into accessible narratives, the program is laying a robust foundation for a generation of critical thinkers who will grow up viewing data not as an intimidating wall of statistics, but as a powerful tool for understanding and shaping their world. Together, through continued community partnerships, volunteer dedication, and innovative educational tools, we can continue helping kids build confidence with data and develop vital skills that will serve them for a lifetime.