In the modern corporate landscape, presenting critical operational data to executive leadership is an exercise in high-stakes communication. When an expected staffing shortfall looms on the horizon, bringing the issue to the attention of decision-makers is an absolute operational necessity. However, a raw forecast in isolation rarely tells the complete story; it highlights a gap, but it fails to illuminate where that gap is originating or why it is occurring. When professionals are tasked with explaining complex underlying drivers, they often face a powerful and counterproductive temptation: attempting to squeeze every minute detail, metric, and cross-reference into a single, overloaded chart.
This exact challenge recently took center stage during a custom client workshop hosted by Storytelling with Data, an organization specializing in transforming dense corporate metrics into clear, actionable insights. The client team in question faced a multifaceted communication hurdle. They needed to convey three distinct yet interconnected messages to their leadership team: first, that full-time equivalent, or FTE, staffing levels were expected to fall significantly below the established operational plan; second, that a notable decline in operations support roles formed a crucial part of the broader narrative; and third, that leadership needed to actively convene and discuss a strategic approach to resolving the looming deficit against the plan.

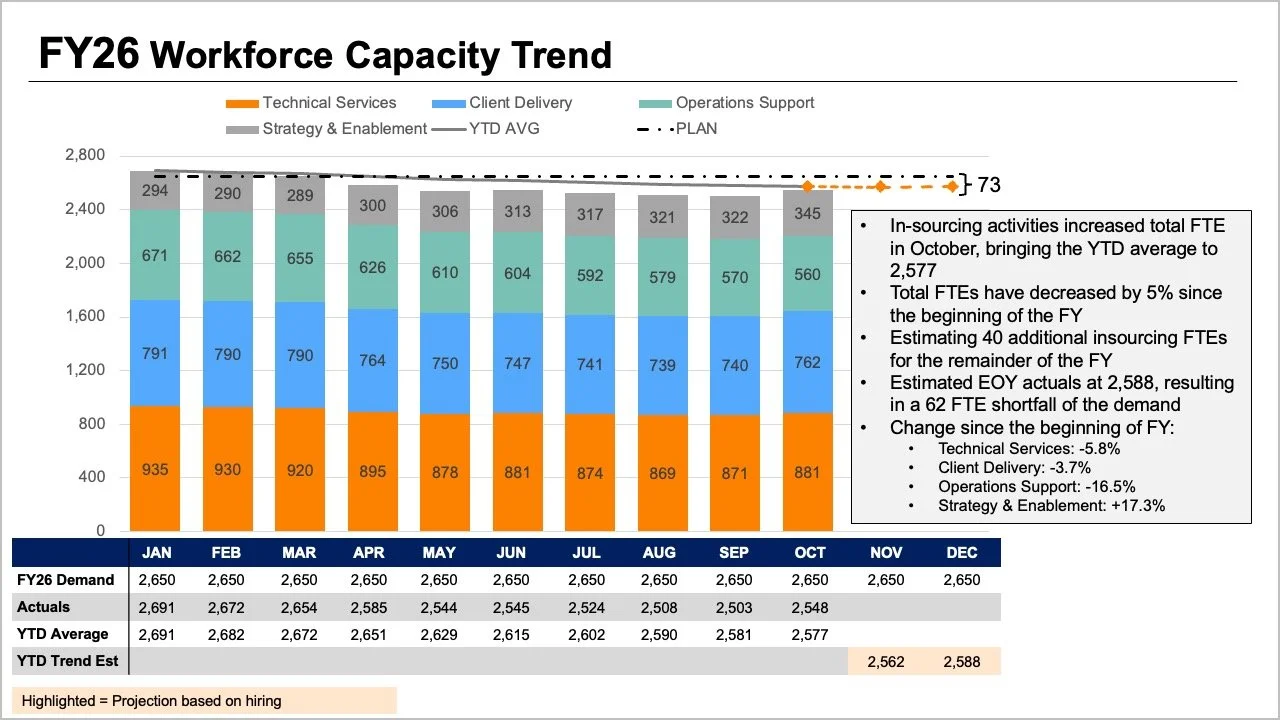
While all the vital information was undeniably present in the initial materials, the core story was effectively buried beneath layers of visual complexity. The original slide asked readers to process multiple disparate elements simultaneously. The tops of stacked bars, conflicting trend lines, and an accompanying data table all attempted to communicate overall FTE figures in different ways. Meanwhile, individual segments within the bars aimed to show a granular breakdown by specific job roles, while plans, actual figures, year-to-date averages, and forward-looking projections added yet another dense layer of interpretation for the audience.
Each individual element within the original presentation answered a reasonable and valid business question. Yet, when crammed together onto a single slide, they created a cognitive bottleneck that made it exceedingly difficult for leaders to answer any single question well. By taking a step back and evaluating what executives actually needed for the strategic conversation ahead, communication experts found a way to guide the presentation of the information more effectively. Leadership ultimately required clear and immediate answers to two foundational questions: How big of a shortfall should the organization realistically expect, and what do the latest staffing data points reveal about where operational changes have actually occurred?
Rather than continuing to pack every available metric into one overburdened graph, the team decided to separate the narrative into two distinct visual components, dedicating one targeted graphic to each core question.
Uncovering the Overall Trend Through Focused Visualization
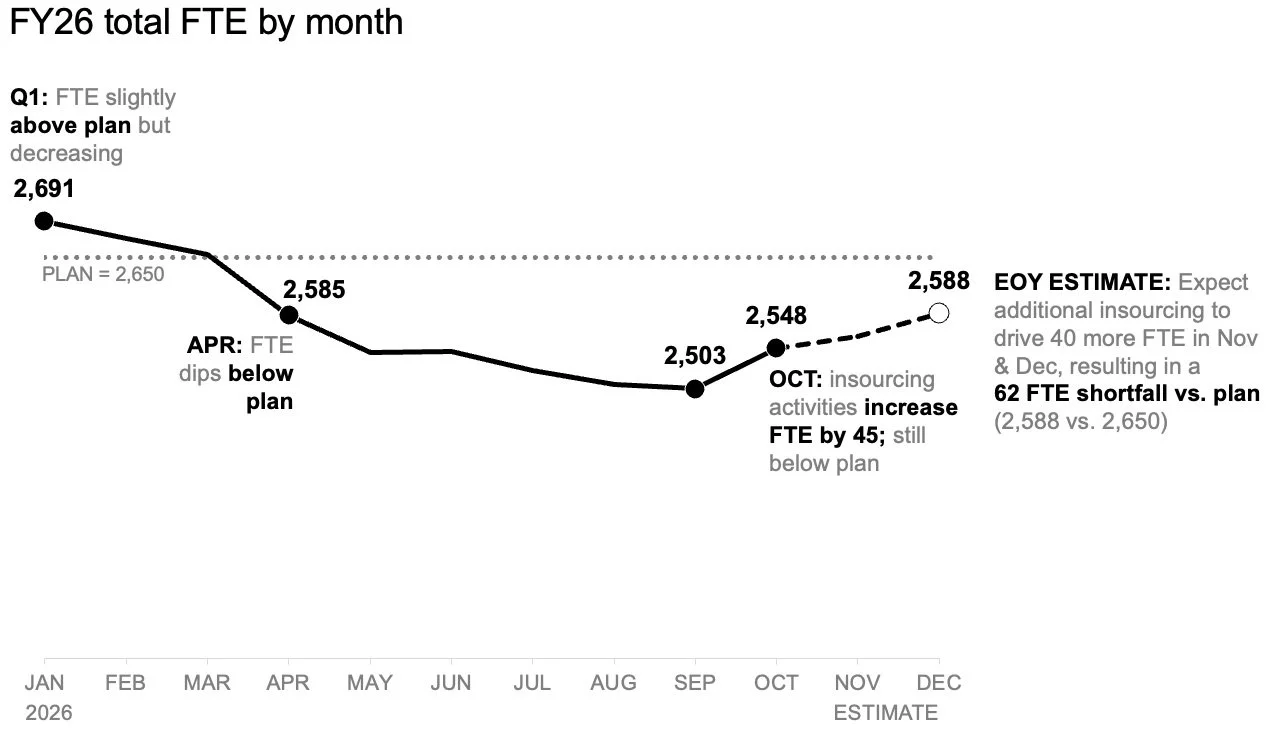
To address the anticipated shortfall clearly, the team first tackled the overarching trend. By shifting from a cluttered multi-metric display to a standalone line chart, it became remarkably easy to track how overall staffing levels had performed against the strategic plan established at the beginning of the year. Furthermore, this simplified view clearly illustrated how future forecasts compared with those initial targets moving forward.
This streamlined perspective also provided ample visual real estate to incorporate meaningful annotations at critical inflection points. Instead of struggling to decode a complicated mix of roles or scanning through a dense initial data table, readers could immediately focus their attention on the expected gap to plan. This targeted approach eliminated unnecessary distractions and established a firm baseline of understanding before any granular discussions began.
Illuminating Role-Level Shifts with Targeted Data Views
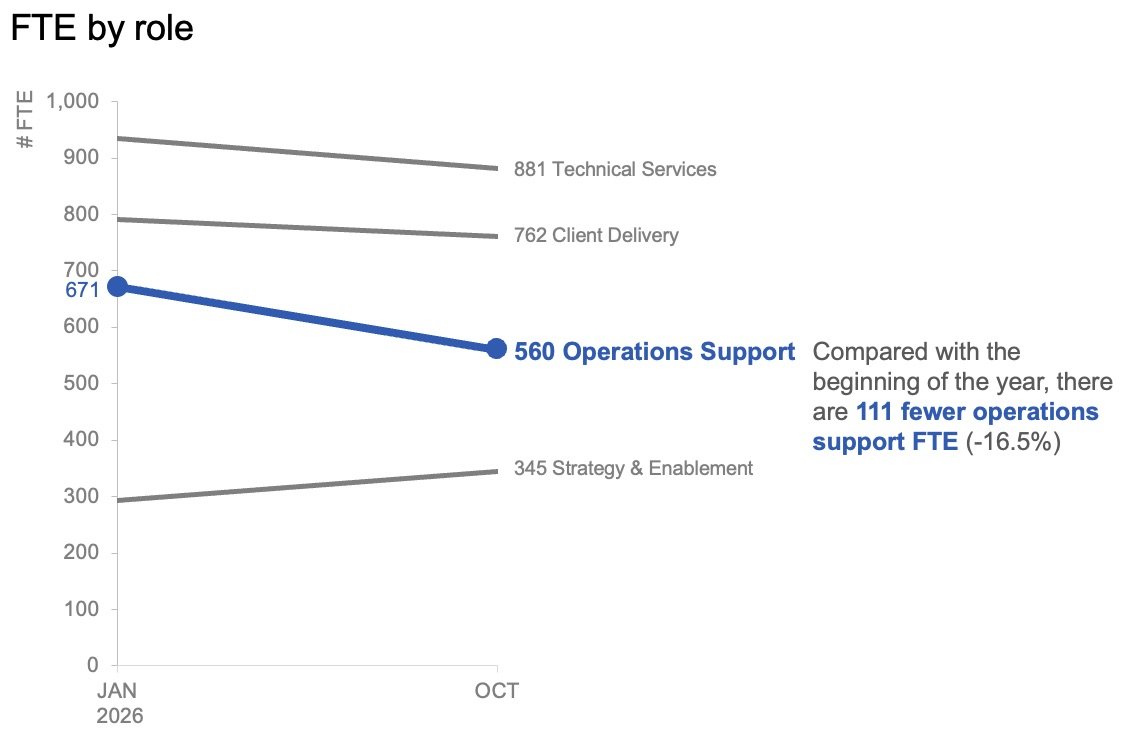
Once the overall trend and the expected deviation from annual targets were established, the next logical step involved examining role-level changes within the actual data to determine where the largest organizational shifts had taken place. In this context, month-to-month operational fluctuations proved to be less critical than the broader trajectory.
To capture this effectively, the team elected to plot only the data points from the start of the year alongside the latest actual month utilizing a slopegraph. This specialized graphical format provided an immediate, intuitive sense of which specific roles had experienced the most substantial changes. By applying color and contextual text sparingly and intentionally, the designers successfully drew the audience’s attention directly toward the decline in operations support roles. As a result, the audience could rapidly identify the primary driver behind the overall staffing deficit without getting lost in extraneous numbers.
These two distinct visuals were ultimately designed to function as a powerful pair. The line chart efficiently answered the broad strategic question of what was happening across the entire organization, while the slopegraph precisely answered the follow-up question regarding which specific roles had shifted the most during the period in question.
Adapting Visual Strategies for Reports Versus Live Presentations
Recognizing that data is consumed in diverse formats across different business environments, the team emphasized the importance of planning how the resulting story would be shared. For static summary reports that might be read independently or forwarded across departments without a live presenter, both visual views can successfully sit together on a single page. In this layout format, a purposeful takeaway slide title clearly states the expected shortfall, while concise supporting text points directly to the decline in operations support roles and signals the urgent need for leadership deliberation. The accompanying charts provide the necessary empirical evidence without competing for cognitive space.
Conversely, for live presentations, the communication strategy adapts to the pacing of human speech. Rather than asking an audience to absorb an entire comprehensive summary all at once while a speaker talks over the slide, presenters can reveal the information piecewise. The discussion can begin by walking through the overall forecast, followed by a gradual reveal of actual role-level changes, and finally concluding with an open conversation about necessary next steps. This intentional sequence allows the audience to fully absorb one critical point before transitioning to the next.
Ultimately, the underlying data and the core message remain entirely consistent regardless of the delivery method. The variable that changes is simply how much information the audience is asked to process at any single moment. When comprehensive pictures require deep detail, the temptation to cram everything into a single view remains strong in the name of perceived efficiency. However, operational experience consistently demonstrates that more information does not automatically generate more understanding. By separating overarching staffing trends from specific role-level changes, complex organizational data can be transformed into a clear, focused narrative that leadership can readily act upon.