In the modern workplace, data visualization has long been dominated by a single, often misunderstood aesthetic mandate: minimalism. Time and time again, presenters are advised to strip away clutter, simplify charts, and reduce text to the absolute bare minimum, under the assumption that fewer words automatically equate to better communication. However, a closer examination of how data is actually consumed reveals that minimalism, when applied blindly, often strips away the very context that makes data useful. The goal of a presentation or a report is rarely to make a slide look sparse; rather, it is to drive understanding and action. Achieving that goal requires a deliberate approach to language, where every word on a slide is selected not for its brevity, but for the specific job it performs.
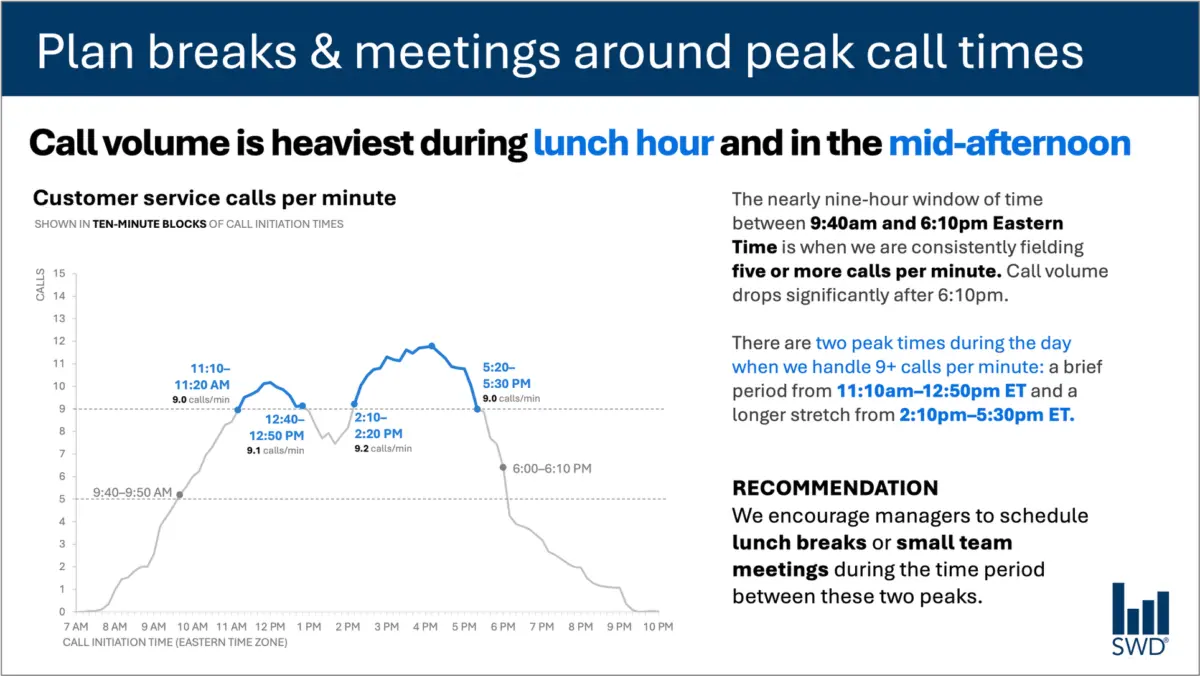
To understand this dynamic, consider a common workplace scenario involving customer service analytics. A standard graph displays call volume fluctuations over the course of a single day. Viewed in isolation, the pattern is clear enough: call volumes begin to climb in the morning hours, remain elevated through the majority of the workday, and form distinct peaks around lunchtime and again in the mid-afternoon.
Yet, in a real-world professional setting, an audience is rarely looking at such a chart simply out of idle curiosity. If the viewers are staffing managers, they are examining the data because they are expected to do something with it. They need to manage schedules, allocate resources, and optimize shift coverages. This crucial distinction—knowing who is looking at the data and why—fundamentally changes how accompanying text should be chosen and structured.
When communication is tailored to the audience’s operational needs, the presentation transforms. Instead of leaving viewers to interpret a raw chart, an effective layout employs targeted text elements. A primary takeaway title, such as a directive to plan breaks and meetings around peak call times, immediately informs staffing managers what matters most. Meanwhile, a descriptive graph title clarifies the exact metric being displayed, such as customer service calls per minute. Strategic annotations pinpoint the precise moments when call volume crosses critical operational thresholds, offering essential context about the two distinct peak periods. Finally, a concrete recommendation translates the visual evidence into a clear action item: scheduling lunch breaks and small team meetings during the lulls between the peaks.
Each of these textual components serves a distinct purpose. This realization challenges the prevailing industry dogma that treating word reduction as an end in itself is always beneficial. Removing all the surrounding text from a graph might create a sleek, minimalist slide, but it ultimately diminishes the slide’s utility. Effective communication relies on adding the right words, rather than arbitrarily cutting them away until nothing of substance remains.
Different Words Do Different Jobs
When deciding which words belong on a graph, dashboard, or slide, creators must first evaluate what their audience requires to decode and act upon the information. Different textual elements fulfill entirely different cognitive and operational functions.
A takeaway title, for instance, moves beyond mere description to communicate the overarching main point or necessary action. A descriptive graph title anchors the audience, orienting them quickly to what they are looking at so they do not have to guess the units or metrics. Direct labels can be employed to eliminate the friction of referring back and forth between the chart and a distant legend. Annotations go a step further by explaining historical context, calling attention to anomalies, or highlighting important trends that may not be immediately obvious from the visual geometry of the data alone. Meanwhile, supporting elements such as axis titles, footnotes, and source information provide granular detail for those who need to verify the underlying numbers.
Not every graph requires every single one of these components. The overarching objective is deliberate design. Communicators must ask themselves what their audience needs in order to truly understand the data, what those viewers should know or do as a result of seeing it, and where a few well-chosen words could eliminate confusion or make a critical point unmistakable. Once those questions are answered, any extraneous words that fail to advance the audience’s comprehension can be safely discarded.
The Insight Has to Come from Somewhere
This delicate balance between data presentation and actionable communication highlights why the human role remains critical, particularly in an era where artificial intelligence tools are increasingly utilized to generate content.
Consider what happens when raw data is handed over to an AI model with a prompt to create a slide based on customer service call volumes. The technology is entirely capable of identifying patterns. It can readily determine that call volumes peak around lunchtime and in the mid-afternoon, and it can synthesize that observation into a polished, grammatically correct sentence.
However, a polished description is not yet an insight.
A genuinely useful recommendation emerges only when raw data is combined with deep contextual awareness. It requires knowing the identity of the audience, understanding why they are looking at the information, recognizing what they care about, and identifying which decisions fall within their operational control. Once a human establishes that the audience consists of staffing managers, a statistical pattern transforms from a passive observation into an actionable strategy.
This principle forms a cornerstone of modern data storytelling frameworks. Before asking artificial intelligence to assist with communication tasks, practitioners must provide the necessary context. AI can undoubtedly help find concise phrasing, suggest compelling titles, propose labels and annotations, and test different ways to articulate a complex idea. Yet, a human operator must still understand the situation well enough to recognize what truly matters.
A polished sentence cannot substitute for genuine insight. Professionals who have spent extended periods working closely with their organization’s data possess tacit knowledge that AI simply cannot replicate. They know the historical background, understand what operational changes occurred on a given day, and comprehend the broader organizational landscape. They can intuitively recognize that one specific movement in a graph is deeply consequential, while another movement that looks equally prominent on the page is entirely negligible.
Bringing that specialized knowledge to a presentation is what separates mediocre reporting from effective communication. The ultimate goal is never about maximizing or minimizing word counts; it is about finding the right words to do the right jobs, making complex analytical thinking visible, and empowering audiences to act with clarity and confidence.