When professionals think about data visualization pitfalls, color is usually the first hazard that comes to mind. A poorly chosen palette can render a chart illegible for individuals with color vision deficiencies, turning an insightful presentation into an opaque wall of confusion. However, color is not the only attribute that can backfire in a professional setting. Motion, too, carries significant risks when deployed without a nuanced understanding of how diverse human brains process visual stimuli.
Consider a company-wide all-hands meeting led by a senior executive at a previous employer. The goal of the presentation was to introduce a suite of new software products and features designed to streamline internal workflows. To showcase the capabilities of the new tools, the presenter incorporated animated slide transitions to introduce the various types of charts the software could generate. As each chart dynamically flew across the screen, one employee found themselves instantly transfixed, staring like a dog spotting squirrels darting through a window. In that single moment of sensory capture, the employee failed to take in a single detail about the charts, nor did they retain a single word of what the presenter was saying.
The root cause of this disconnect lies in neurodiversity. The employee lives with inattentive attention deficit/hyperactivity disorder (ADHD). Like many individuals with ADHD, they are exceptionally tuned to motion. The moving elements on the slide acted as an inescapable cognitive anchor, completely derailing their ability to process the core message. The presenter, operating with standard presentation conventions, simply had not considered how animated slide elements might prove distracting to an audience member, let alone to individuals with specific neurodivergent traits.
Reflecting on the incident, both the presenter and the audience member fell victim to a shared trap: they underestimated the deep importance of the audience, while simultaneously leaning too heavily on a single design attribute. In the broader landscape of data communication, the core tenet remains absolute—knowing your audience matters just as much as knowing the technical science of data visualization.
This emphasis on audience awareness is a recurring theme in professional communication circles for good reason. What ultimately gets in the way of comprehension is not always a matter of simple personal preference or aesthetic taste. Frequently, it is a reflection of how an individual’s eyes and brain are wired to function. Getting ahead of these cognitive hurdles requires a deliberate, two-pronged approach. Communicators must actively learn more about the specific composition of their audience, while also layering multiple visual attributes together rather than relying on a single sensory channel, which significantly reduces the risk that an approach will miss the mark.
Learn what works for your audience
Understanding the specific needs of an audience begins with direct engagement. When communicators have direct access to their stakeholders, colleagues, or clients, they have a unique opportunity to bring concrete examples to the table and ask for feedback directly. This involves engaging in active dialogue, presenting draft visualizations, and soliciting insights on how different design choices impact readability, comprehension, and cognitive load.
However, professional reality dictates that direct access to every audience member is not always possible. When direct consultation is out of reach, professionals must rely on alternative strategies to gauge what their audience expects and how they naturally process information. This involves studying established communication patterns within the target organization or industry, reviewing prior successful presentations, and observing how stakeholders traditionally interact with reports and dashboards.
Conducting this kind of preliminary research is fundamentally distinct from directly collaborating with an audience, but it provides a critical advantage. Background research can give a communicator a substantial leg up, helping them make a strong and effective first impression. By examining concrete examples of how a specific group talks about data, designs visual artifacts, and structures presentations, communicators can illuminate a path forward that aligns closely with the audience’s inherent cognitive habits and preferences.
Combine attributes thoughtfully
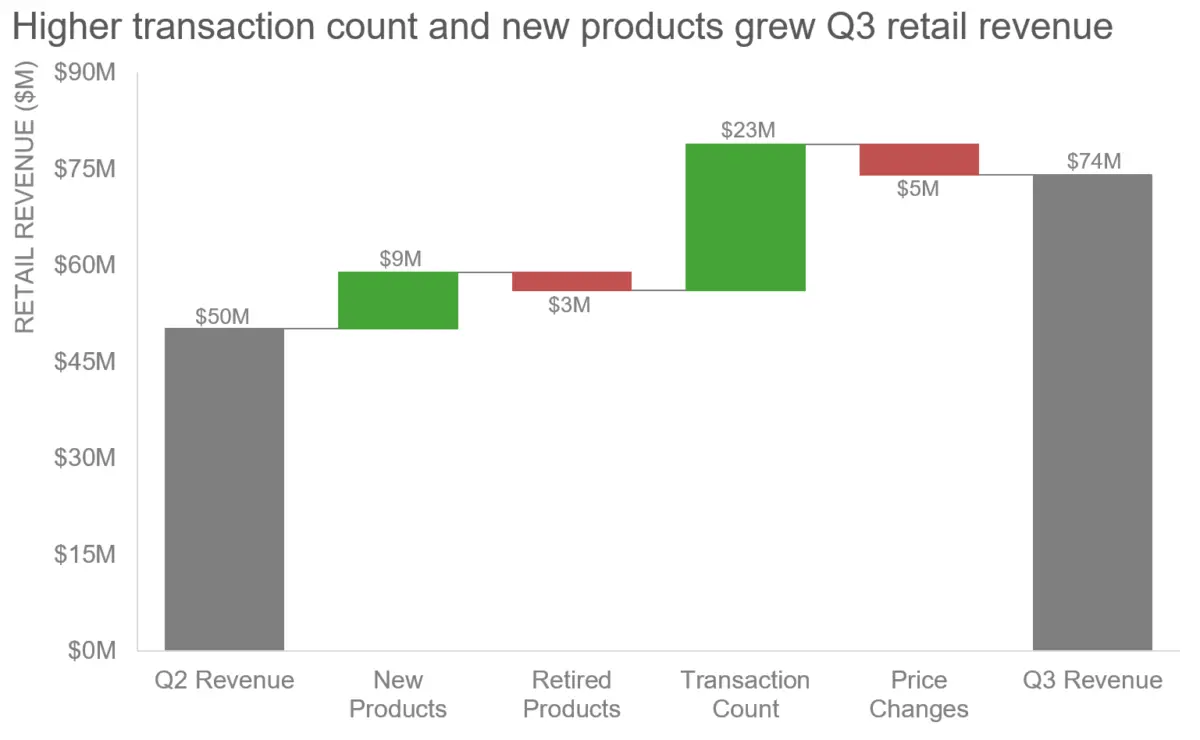
To move beyond single-attribute vulnerabilities, communicators must also rethink how they deploy visual elements such as color and motion. Re-evaluating past mistakes provides a clear roadmap for improvement. For instance, revisiting a problematic chart—such as a complex waterfall chart utilizing stark red and green color coding—reveals that color can still be a highly effective tool if applied with greater strategic intent.
Rather than abandoning color or motion entirely, the key lies in thoughtful integration. By combining multiple visual attributes, such as pairing color shifts with clear textual labels, distinct shapes, and measured spatial arrangements, communicators create redundant pathways for information processing. This multi-layered approach ensures that if one attribute proves challenging for a segment of the audience due to visual impairment, neurodivergence, or personal preference, other attributes remain available to carry the message forward.
Ultimately, bridging the gap between data and audience comprehension requires moving past rigid, one-size-fits-all presentation habits. By acknowledging the reality of audience neurodiversity and blending design attributes with care, presenters can ensure their message reaches every member of the room.