In the modern corporate landscape, data visualizations have become ubiquitous. From executive dashboards to daily operational slide decks, organizations rely heavily on charts and graphs to communicate complex metrics. Yet, a fundamental misunderstanding frequently undercuts these visual efforts: the persistent belief that minimalism equates to effectiveness, and that stripping away surrounding text inherently improves a communication.
This philosophy is increasingly challenged by communication professionals who argue that data visualization without context, narrative structure, and deliberate copywriting often fails its primary objective. The real challenge of data storytelling is not about reducing elements until a slide looks clean, but rather about deploying the right words to make analytical insights actionable.
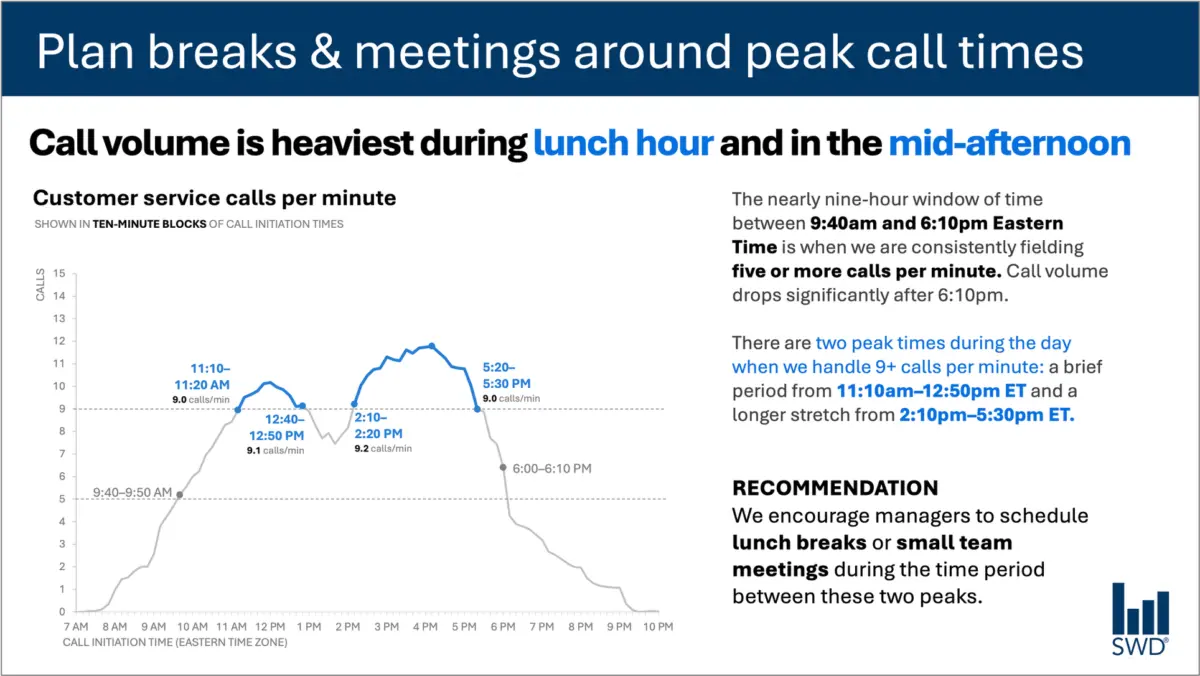
Consider a standard operational graph tracking customer service call volume throughout a typical business day. On its own, the visual pattern is straightforward enough. Line graphs or bar charts reveal that incoming calls begin to climb steadily in the morning hours, remain consistently elevated through much of the core workday, and form distinct peaks around the lunch hour and once again in the mid-afternoon.
A purely aesthetic approach to this visualization might isolate the chart, removing all external labels, commentary, and contextual text to achieve a sleek, minimalist presentation. But if the audience viewing the slide consists of workforce staffing managers rather than data analysts driven by casual curiosity, a minimalist approach misses the mark. These managers are not looking at the data simply to admire a pattern; they are viewing it because they need to make operational decisions. The presence of this specific audience fundamentally alters what the communication needs to achieve.
When context drives design, the textual elements surrounding a visual undergo a complete transformation. Instead of a generic label, an effective slide might feature a commanding takeaway title such as "Plan breaks and meetings around peak call times." This specific headline immediately communicates what matters most to the viewer. Meanwhile, a descriptive graph title, such as "Customer service calls per minute," clearly orients the audience to the raw data they are examining.
To bridge the gap between raw metrics and human action, annotations can be layered onto the visualization to pinpoint precisely when call volume crosses crucial operational thresholds, adding valuable background color regarding the nature of the two daily peaks. Finally, a clear recommendation translates the visual evidence into a concrete directive: schedule lunch breaks and small team meetings specifically during the lulls between the peaks.
Every piece of surrounding text has a distinct job to perform. Stripping away all of the text to achieve a minimalist design might result in a visually sparse slide, but it ultimately diminishes its utility. Effective communication relies on adding the right words to guide the audience to the correct conclusion.
Different Words Do Different Jobs
When deciding which words belong on a graph, a dashboard, or a presentation slide, creators must first evaluate what their audience requires to fully comprehend and act upon the information. Different textual elements serve entirely different functions within a single visual presentation.
A takeaway title communicates the core message or the recommended action, ensuring that even a rushed viewer grasps the primary takeaway without deciphering the underlying data points. A descriptive graph title acts as an orienting mechanism, telling the audience what they are looking at in clear, unambiguous terms. Direct labels can be utilized to eliminate the cognitive friction of cross-referencing a chart against a distant legend, keeping the audience’s attention focused squarely on the data points themselves.
Furthermore, annotations serve a narrative purpose by explaining historical anomalies, drawing attention to critical anomalies, or injecting context that cannot be derived from the numbers alone. Axis titles, footnotes, and source information remain available to provide necessary granularity when deeper verification is required.
Crucially, not every graph requires every single one of these components. The overarching goal is deliberate communication. Creators must continuously ask what their audience needs to understand a graphic, what those viewers should know or do as a direct result of seeing it, and where a few well-chosen words could eliminate confusion or cement a crucial point. Once those necessary elements are established, any extraneous words that fail to add value can be discarded.
The Insight Has to Come from Somewhere
This nuanced approach to communication highlights why the human role remains irreplaceable, particularly in an era where artificial intelligence tools are increasingly integrated into data analysis and content generation workflows.
Imagine feeding complex call-volume data into an advanced artificial intelligence system and prompting it to construct a presentation slide. Capable of recognizing patterns within structured datasets, the AI would likely identify the diurnal rhythm of the inbound traffic. It might accurately determine that call volume peaks around lunchtime and during the mid-afternoon, and it could effortlessly generate a polished, grammatically correct sentence describing those observations.
However, a polished descriptive sentence is not yet an insight.
A truly useful recommendation requires combining raw data with external context that an algorithm cannot inherently perceive. Who is the specific audience? Why are they reviewing this information? What do they genuinely care about? What operational decisions are actually within their control? Once a human operator establishes that the audience consists of staffing managers, a simple descriptive pattern is transformed into an actionable directive.
This principle forms the core of modern data storytelling frameworks: generative artificial intelligence must be provided with adequate context before it can assist effectively with communication tasks. AI tools excel at finding concise wording, suggesting alternative titles, drafting labels, testing various ways to articulate an idea, and refining syntax. Yet, a human operator must still possess a deep enough understanding of the real-world situation to recognize what truly matters.
Professionals who spend time immersed in their organization’s data inherently possess knowledge that AI models lack. They understand the historical background, the recent policy shifts, the broader organizational culture, and the specific pressures facing their stakeholders. A human analyst might instantly recognize that one seemingly minor fluctuation on a graph represents a critical operational breakdown, while another prominent spike is merely a harmless, expected artifact of routine system testing.
Bringing that experiential knowledge to the design process allows professionals to use words to make their strategic thinking visible. The ultimate objective is never a matter of maximizing or minimizing word counts. Rather, it is about deploying the right words to ensure every element on the page is actively performing its intended job.