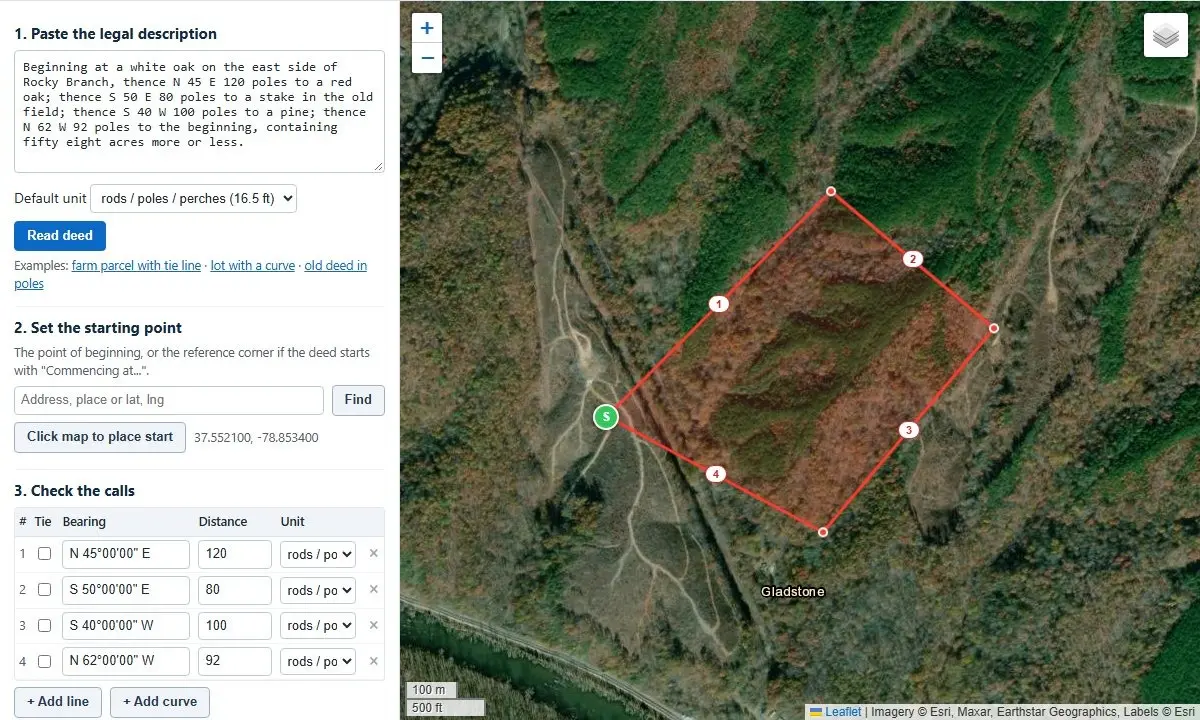
A specialized web-based deed plotting tool allows landowners, legal professionals, real estate analysts, and historical researchers to instantly transform written legal property descriptions into visual boundary lines overlaid directly onto high-resolution satellite imagery. The digital application processes boundary directions and distances—known in surveying terminology as "calls"—to calculate total acreage, verify mathematical boundary closure, and pinpoint potential transcription errors within recorded legal documents.
Designed to process both contemporary real estate deeds and historical surveys dating back to the colonial era, the tool addresses long-standing challenges in mapping real property. By interpreting complex legal phrasing, archaic measurement systems, and curved boundary lines without requiring manual data reformatting, the browser-based platform provides a practical bridge between traditional textual land records and modern geographic information systems.
How the Deed Plotting Process Works
The core mechanics of the deed plotter center on converting text-based spatial data into accurate geometric figures on a digital map. Users begin by pasting the complete legal description from a land deed or title record directly into the software interface. The application’s parsing engine automatically reads the sequential calls that define the perimeter of the property, recognizing boundary bearings, distances, and geometric curves.
Once the textual data is parsed, the software constructs the boundary lines step by step on top of interactive satellite imagery. This automated visual rendering enables users to immediately see how a property’s recorded dimensions align with visible physical features on the ground, such as roads, fence lines, watercourses, and adjacent parcel boundaries.
For descriptions that require manual adjustments or individual line entries, the interface provides dedicated controls to add specific lines and curves manually. Users can input bearings and distances individually to construct custom property profiles or adjust specific sections of a plot. Additionally, specialized companion tools—such as dedicated bearing and distance calculators for quick single-line plotting and interactive acreage calculators for direct map drawing—are integrated into the platform to support custom spatial tasks.
Automated Parsing of Diverse Legal Descriptions
Legal descriptions in land deeds vary significantly depending on the region, the era in which the survey was conducted, and the stylistic preferences of the preparing attorney or surveyor. The plotter is built to interpret a wide variety of standard legal description styles without requiring users to manually reformat or clean up the raw text before pasting.
The system natively processes modern bearings written in standard degrees, minutes, and seconds, alongside complex circular boundary calls, tie lines, and non-tangent curves. Furthermore, the tool successfully reads historical deed formulations where distances and bearings are written out entirely in words rather than numerical figures—a common characteristic of eighteenth- and nineteenth-century property records.
To maintain diagnostic clarity, the application features an integrated syntax checking system. If the parsing engine encounters ambiguous text, incomplete calls, or formatting non-conformities that it cannot interpret with full certainty, it generates a clear yellow warning note directly beneath the main text entry box. This notification alerts the user to the specific calls that require manual verification against the original paper document, ensuring that parsing errors are identified before final mapping calculations are made.
Evaluating Area, Misclosure Ratios, and Diagnostic Error Tracking
In legal surveying, a complete property description must form a closed geometric loop, ending at the exact location where it began—a starting location officially designated as the Point of Beginning. The spatial gap remaining between the final surveyed corner and the Point of Beginning is referred to as the misclosure.
To determine the mathematical quality of a land description, the software calculates the precision ratio by dividing the total perimeter length of the parcel by the distance of the misclosure gap. Modern land surveys typically achieve precision levels better than 1 : 10,000, indicating a highly accurate boundary line. Conversely, historical deeds originating from the compass-and-chain era frequently exhibit closure precision ratios ranging between 1 : 200 and 1 : 1,000. Within the historical context of early surveying technology, ratios in this range are considered normal and expected.
When a legal description fails to close properly, the issue can often be traced to a single localized error in the recorded text, such as a swapped directional cardinal (mistaking North for South or East for West), an inverted bearing, or a mistyped numerical distance. To resolve these discrepancies, the plotter features a dedicated diagnostic tool called "Find the bad call." This diagnostic engine systematically analyzes each call in the description, testing structural modifications and generating a prioritized list of specific text corrections that would successfully close the boundary figure, placing the most mathematically probable correction at the top of the list.
Alongside closure testing, the software performs precise geometric area calculations based on the text of the deed as written. When calculating acreage for properties bounded by curved lines, the algorithm includes the exact area contained within circular arc segments—specifically accounting for the slice of land situated between the chord line and the outer arc. Computed area results are presented simultaneously across multiple standard units, including total acres, square feet, and hectares.
Decoding Historical Surveys, Legacy Units, and Magnetic Declination
Mapping older land titles presents unique historical and geophysical challenges. Colonial and early American land surveys were routinely performed using physical measuring chains and magnetic compasses, utilizing measurement units that are rarely encountered in contemporary real estate transactions.
The deed plotter natively recognizes and converts legacy measurement units into modern linear distances:
- Poles, Perches, and Rods: Historically interchangeable linear units, each defined as exactly 16.5 feet.
- Chains: Standard surveying chains equal to 66 feet, with each chain subdivided into 100 links measuring 0.66 feet each.
- Texas Varas: A traditional regional unit defined in Texas land measurement as 33 1/3 inches (approximately 2.78 feet).
- Acreage Conversions: Spatial calculations preserve the historic standard where 10 square chains equal exactly one acre.
Beyond archaic units of measurement, historical surveys are complicated by magnetic declination—the varying angular difference between magnetic north (as indicated by a physical compass needle) and true geographic north. Because the Earth’s magnetic poles drift over time, a bearing recorded via a magnetic compass in the eighteenth or nineteenth century will not line up with true north on contemporary satellite imagery.
To realign historical survey lines with current geographic coordinates, the tool includes a specialized rotation input box where users can enter the historical magnetic declination corresponding to the year and location of the original survey. In this system, positive values represent east declination, while negative values represent west declination. By combining present-day magnetic values—obtainable via the platform’s interactive magnetic declination calculator—with historical declination datasets provided by organizations like the National Oceanic and Atmospheric Administration (NOAA), researchers and genealogists can accurately re-orient ancestral land descriptions onto modern satellite maps.
Data Integration and Export Capabilities for CAD, GIS, and Google Earth
To support professional workflows across land surveying, legal preparation, and geospatial analysis, the deed plotter provides comprehensive data export capabilities. Once a legal description has been processed, visual boundary lines and calculated vector geometry can be converted into standard file formats compatible with external software systems.
Users can export plotted parcels directly into computer-aided design (CAD) software formats for technical drafting, as well as geographic information system (GIS) layers for broader spatial analyses. Additionally, the software generates downloadable KML and KMZ files, allowing boundary lines and calculated property shapes to be imported seamlessly into mapping applications such as Google Earth for 3D visualization and spatial cross-referencing.
Metes and Bounds Frameworks Versus the Public Land Survey System
Understanding how a deed is plotted requires recognizing the underlying land survey system used in the property’s jurisdiction. Real estate descriptions in the United States generally follow one of two primary structural systems: Metes and Bounds or the Public Land Survey System (PLSS).
The Metes and Bounds system defines real estate boundaries by physically "walking" the perimeter of the property. It starts at a designated Point of Beginning and follows a continuous series of sequential directional bearings and linear distances around the perimeter until returning to the start. Metes and bounds is the foundational legal framework utilized throughout the original thirteen American colonies, eastern states, and Texas.
In contrast, most of the central and western United States was organized under the Public Land Survey System (PLSS), which systematically divides land into standardized grids of townships, ranges, and sections. Modern real estate descriptions frequently blend both methodologies, utilizing a hybrid structure that ties a traditional metes-and-bounds parcel outline to a specific PLSS section corner marker.
To assist users working with combined survey systems, the platform provides integrated auxiliary tools, including a section, township, and range finder, alongside a PLSS coordinate converter. These tools help users locate specific section grids on modern maps and convert PLSS grid references into explicit spatial coordinates suitable for deed plotting.
Clarifying Technical Capabilities and Surveying Distinctions
While digital deed plotting provides powerful visual and diagnostic capabilities, there is an essential legal and operational distinction between plotting a written deed description and performing an official land survey.
A deed plotter generates a mathematical visual representation of what is recorded within a written legal text. In contrast, an official land survey requires physical field investigation by a licensed professional land surveyor, who locates physical ground monuments, inspects boundary markers, evaluates historic boundary evidence, and certifies property lines on the ground. The deed plotter serves as an exploratory and analytical tool to help landowners, researchers, real estate professionals, and attorneys review document accuracy, spot mathematical transcription errors, and prepare for informed consultations with licensed land surveyors or legal representatives.
When a deed description fails to close properly, the issue usually stems from identifiable source errors:
- Transcription or typographical errors in a single bearing direction or linear distance.
- Complete omission of a call during document copying or re-recording.
- Undefined or incomplete curve parameters within the text.
- Original survey limitations stemming from historical compass-and-chain field measurements.
By utilizing the diagnostic output of the "Find the bad call" panel and cross-referencing generated call tables against original historical documents, users can quickly identify and isolate discrepancies.
Local Processing Architecture and Privacy Safeguards
Data security and user privacy are fundamental elements of the deed plotting software’s technical design. The entire application operates completely within the client’s web browser environment.
When a user pastes confidential legal descriptions or proprietary property data into the plotter, the information is processed entirely locally on the user’s device. No deed texts, coordinate data, or personal information are uploaded to external servers, stored in remote databases, or transmitted across network connections. This architecture ensures complete client data privacy while providing real-time spatial processing directly on screen.