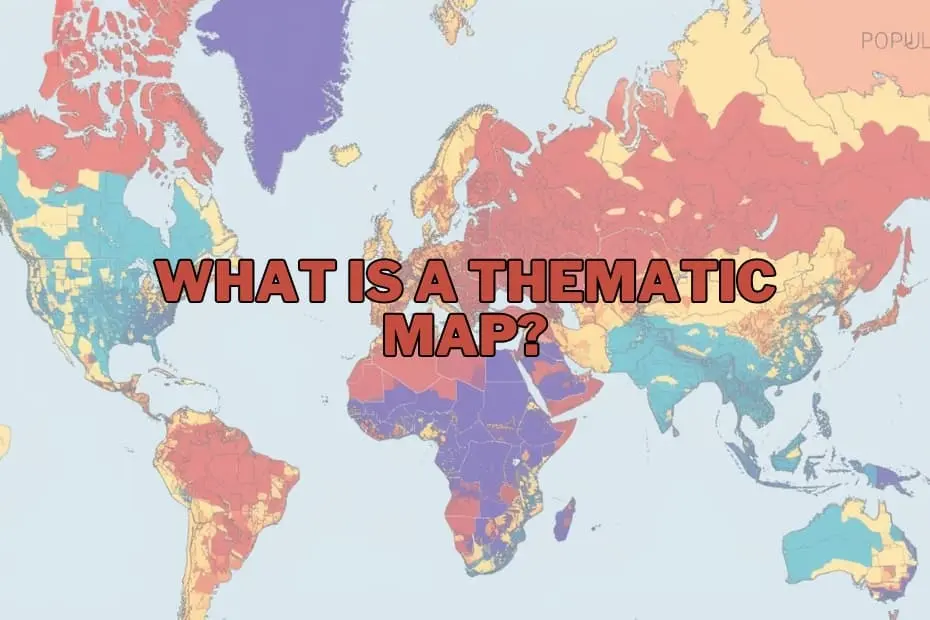
In the modern era of big data, information is abundant, but understanding is often scarce. In the fields of geography, urban planning, and data science, maps have evolved far beyond their traditional role as simple tools for navigation. Today, they serve as sophisticated instruments for telling complex stories, uncovering hidden patterns, and making sense of massive datasets.
Among the various cartographic tools available to researchers and decision-makers, thematic maps stand out as an invaluable resource. While a standard road map tells us where a city is, a thematic map can tell us how the people living in that city are distributed by income, health status, or environmental exposure. By focusing on specific subjects, thematic maps transform abstract, spreadsheet-bound data into intuitive visual narratives.
Understanding the Thematic Map
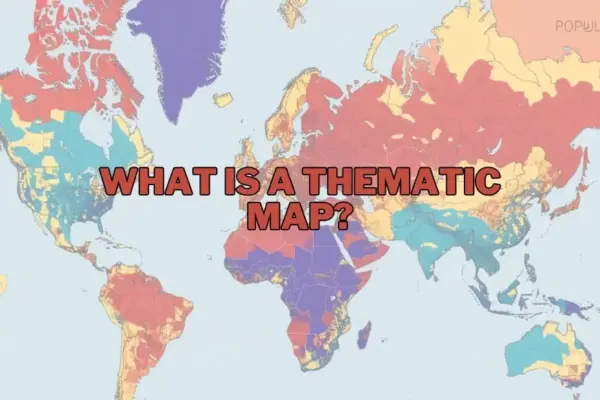
A thematic map is a specialized map designed to visualize specific data themes or patterns associated with geographic locations. Unlike general reference maps—which focus on physical features, roads, water bodies, and political boundaries—thematic maps emphasize a particular subject. This subject can range from population density and climate zones to economic activity, disease outbreaks, or voting patterns.
The primary objective of a thematic map is to illustrate the spatial distribution of a single attribute or the relationship between multiple attributes. By utilizing visual variables such as color gradients, shading, symbols, and structural distortions, these maps allow viewers to immediately grasp spatial patterns, trends, and anomalies that would otherwise remain hidden in raw data tables. For geographers, policymakers, and business analysts, thematic maps serve as a critical bridge between statistical data and spatial reality.
The Purpose and Importance of Spatial Visualization
The fundamental purpose of a thematic map is to communicate complex spatial data quickly and effectively. Humans are highly visual creatures, and digesting columns of geographic coordinates and numerical values is notoriously difficult. A thematic map simplifies this process, allowing users to identify spatial relationships that might otherwise go unnoticed.
The importance of this visualization technique spans numerous disciplines:
- Environmental Policy: Thematic maps can illustrate how rising global temperatures correlate with agricultural yields, or trace the geographic spread of deforestation over decades.
- Urban Planning and Development: Municipalities rely on these maps to visualize population growth patterns, allowing them to make informed decisions about where to build new schools, transit lines, and utility infrastructure.
- Public Health: Epidemiologists use thematic maps to track the spread of infectious diseases, identify localized health disparities, and allocate medical resources to high-risk areas.
- Economic Analysis: By mapping indicators such as household income, unemployment rates, and retail spending, businesses and economists can identify market opportunities and analyze regional economic health.
Ultimately, thematic maps do more than display data—they provide actionable insights that drive policy, strategy, and scientific discovery.
A Taxonomy of Visual Data: Types of Thematic Maps
Depending on the nature of the dataset and the story a cartographer wishes to tell, different types of thematic maps are deployed. Each type possesses unique structural characteristics and visual strengths.
Choropleth Maps
The choropleth map is perhaps the most recognizable type of thematic map. It uses progressive color gradients or shading patterns applied to predefined administrative areas—such as countries, states, counties, or census tracts—to represent different values. For example, a map showing household income might shade wealthier counties in dark green and lower-income counties in light green.
While highly effective for representing standardized data (such as population density or percentage rates), choropleth maps can be misleading if used to display raw totals, as larger geographic areas can disproportionately draw the viewer’s eye regardless of the underlying data density.
Proportional and Graduated Symbol Maps
When the goal is to represent raw quantities rather than ratios, proportional or graduated symbol maps are highly effective. These maps place symbols—most commonly circles—over specific geographic points or regions. The size of the symbol is directly proportional to the value of the data it represents. For instance, a map of major global airports might use larger circles to represent higher annual passenger volumes. This approach allows viewers to compare absolute quantities across different locations at a single glance.
Dot Density Maps
Dot density (or dot distribution) maps use individual dots to represent a specified quantity of a given phenomenon. Each dot might represent one hundred people, ten agricultural farms, or a single occurrence of a rare event. By scattering these dots across a map, cartographers can display the density and dispersion of a variable without relying on artificial administrative boundaries. The resulting visual clusters provide an intuitive sense of where a phenomenon is most concentrated.
Isoline and Isarithmic Maps
Isoline maps connect points of equal value using continuous lines, creating a smooth representation of continuous geographic data. The most common examples are topographic contour maps showing elevation, but isolines are also widely used in meteorology to display temperature variations (isotherms) or atmospheric pressure (isobars). These maps are essential for visualizing phenomena that transition gradually across space rather than stopping abruptly at political borders.
Cartograms
A cartogram is a unique thematic map that intentionally distorts geographic reality to convey data. In a cartogram, the physical size of a geographic area (such as a country or state) is resized in proportion to a specific variable, such as population or gross domestic product (GDP). For example, a population cartogram of the world would show India and China as massive landmasses, while Canada and Russia would appear significantly shrunken. While cartograms can confuse viewers unfamiliar with basic geography, they are incredibly powerful for emphasizing structural inequalities and disparities.
Anatomy of a Spatial Story: Key Elements of Design
Creating an effective and accurate thematic map requires careful attention to cartographic design. Without the proper structural elements, a map can easily confuse the reader or, worse, misrepresent the underlying data.
- The A clear, concise title is vital. It must establish the theme of the map, the geographic region covered, and the time period of the data represented.
- The Legend: Often referred to as the "decoder ring" of the map, the legend explains what the colors, symbols, sizes, and shading patterns mean. A poorly designed legend can render an entire map useless.
- Map Scale and Orientation: Even though thematic maps focus on data rather than navigation, a scale bar and a north arrow remain important for establishing spatial context and distance relationships.
- Data Classification and Intervals: How data is grouped into classes (e.g., equal intervals, natural breaks, or quantiles) heavily influences the visual output of a map. Cartographers must choose classification methods that accurately reflect the data distribution without introducing bias.
- Data Source and Metadata: Transparency is crucial in journalism and academic research. Every thematic map should clearly state the origin of its data to build trust and allow for verification.
- Base Map: The background map should be simple and unobtrusive. Excessive detail on the base map—such as unnecessary roads or terrain features—can distract from the thematic data being highlighted.
Real-World Impact: Diverse Applications Across Sectors
The utility of thematic mapping extends far beyond academic geography. In the modern, data-driven professional landscape, these maps serve as essential diagnostic and planning tools.
In public health, the legacy of thematic mapping stretches back to Dr. John Snow’s famous 1854 cholera map of London, which traced the source of an outbreak to a specific public water pump. Today, modern epidemiologists utilize real-time GIS mapping to track viral vectors, analyze vaccine distribution equity, and study how environmental factors impact chronic diseases.
In the business and commercial sectors, thematic maps are used for site selection and market analysis. Retail chains analyze demographic maps to identify neighborhoods with high concentrations of target consumers before opening new locations. Logisticians map transit times and supply chain networks to optimize shipping routes and reduce operational costs.
In environmental conservation and climate science, these maps are indispensable. Scientists map carbon emissions, track sea-level rise projections along coastal communities, and identify critical wildlife habitats threatened by human encroachment. By visually linking environmental degradation to specific geographic coordinates, advocates and policymakers can target conservation efforts where they are needed most.
The Double-Edged Sword: Advantages and Inherent Limitations
While thematic maps are incredibly powerful communication tools, they are not without their pitfalls. Understanding both their strengths and limitations is essential for anyone who creates or interprets them.
Advantages
The primary advantage of a thematic map is its ability to simplify vast, complex datasets into an easily digestible visual format. They allow for rapid pattern recognition, helping users identify geographic clusters, spatial anomalies, and regional trends in seconds. Furthermore, they facilitate comparisons between different geographic regions, making them highly persuasive tools for public presentations, policy advocacy, and executive decision-making.
Limitations
Conversely, thematic maps can easily mislead if designed poorly or interpreted without caution. One major limitation is the Modifiable Areal Unit Problem (MAUP), a phenomenon where drawing different administrative boundaries can radically alter the apparent spatial patterns of the data.
Additionally, thematic maps often require data generalization, which can smooth over localized variations and create a false impression of uniformity within a shaded region. For example, a choropleth map shading an entire state red or blue based on average voting patterns masks the complex political diversity within individual neighborhoods and counties. Finally, a thematic map is only as reliable as the underlying dataset; inaccurate or outdated data will inevitably yield a misleading map.
The Modern Cartographer’s Toolkit
The days of hand-drawing thematic maps with ink and paper are long gone. Today, a sophisticated array of software and digital tools allows anyone from amateur enthusiasts to professional cartographers to create stunning, interactive spatial visualizations.
- Geographic Information Systems (GIS): Professional-grade software suites like Esri’s ArcGIS and the open-source platform QGIS are the industry standards. These systems offer robust tools for spatial analysis, data manipulation, and precise cartographic design.
- Business Intelligence (BI) Platforms: Software such as Tableau and Power BI has increasingly integrated spatial mapping capabilities, allowing business analysts to connect corporate databases directly to interactive map dashboards.
- Web Mapping and APIs: For web developers and journalists, platforms like Mapbox, Carto, and Leaflet make it possible to build dynamic, zoomable thematic maps that can be embedded directly into websites and digital publications.
These modern technologies have democratized cartography, turning spatial visualization from a highly specialized craft into an accessible medium for universal storytelling.
Frequently Asked Questions
What is the main difference between a thematic map and a reference map?
A reference map (like a road map or topographic map) is designed to show the locations of diverse geographic features such as roads, rivers, cities, and political boundaries for navigational purposes. A thematic map, on the other hand, focuses on representing the spatial pattern of a single specific theme, such as population density or average rainfall.
Can thematic maps be used to represent historical data?
Yes, thematic maps are highly effective for visualizing historical trends and changes over time. By comparing a series of thematic maps from different eras, researchers can track phenomena such as urban expansion, migration patterns, geopolitical shifts, or environmental changes across decades or centuries.
What software is best for beginners who want to create thematic maps?
For beginners, QGIS is a highly recommended open-source desktop application because it is completely free and supported by a vast, helpful global community. For those looking for simpler, more drag-and-drop web-based tools, platforms like Tableau or Carto offer user-friendly interfaces that require little to no programming knowledge to generate clean, professional maps.
How do I choose the correct type of thematic map for my dataset?
The choice depends entirely on the nature of your data. If you are working with standardized data or percentages divided by administrative boundaries, a choropleth map is often appropriate. If you are dealing with raw totals and quantities at specific points, a proportional symbol map is a better choice. For continuous physical phenomena like temperature or elevation, an isoline map is the most accurate representation.