In the realm of corporate communications and data presentation, a persistent design philosophy has long favored radical minimalism. The prevailing wisdom often dictates that removing elements from a slide or a graph inherently improves its clarity. However, a closer examination of how audiences actually interact with data reveals a more nuanced reality: stripping away all surrounding text in the pursuit of a clean aesthetic frequently sacrifices utility. The fundamental goal of data visualization is not simply to look sparse, but to communicate effectively, a process that relies heavily on deploying the right words to do specific jobs.
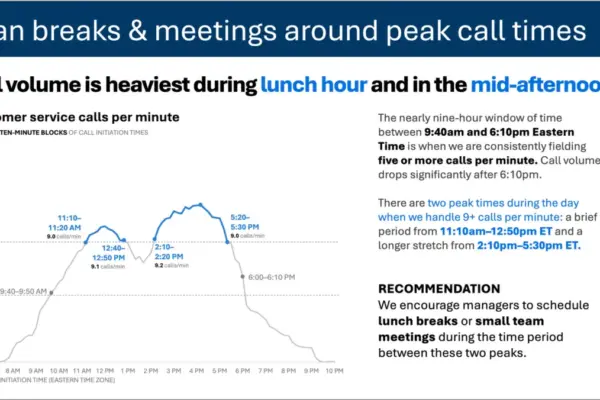
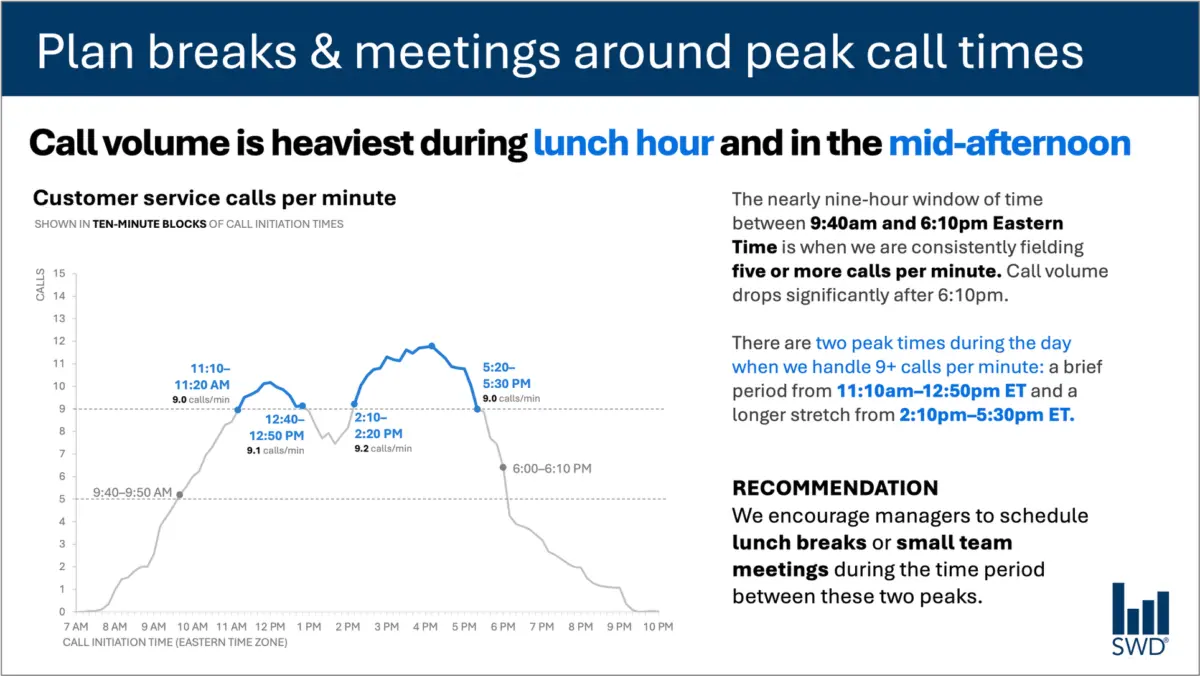
Consider a standard graph illustrating customer service call volume throughout a typical business day. Viewed in isolation, the dataset presents a clear behavioral pattern: call frequencies begin to climb in the early morning hours, remain consistently high across the majority of the standard workday, and spike noticeably around the lunch hour before experiencing a secondary peak in the afternoon.
On its own, this visualization offers a passive overview of operational rhythms. But when the intended audience changes—such as when the viewers are staffing managers tasked with operational planning—the strategic purpose of the visualization shifts dramatically. These professionals are not examining the data out of idle curiosity; they are looking at information designed to inform decisions. This specific context alters the textual ecosystem required to make the graphic functional.
When a staffing manager views the call volume trajectory, the accompanying text must bridge the gap between raw data and operational action. Instead of a generic label, an effective takeaway title might read: Plan breaks & meetings around peak call times. This phrasing immediately tells the viewer what matters most. Meanwhile, a precise descriptive graph title—such as Customer service calls per minute—orients the audience to the baseline metrics they are observing.
Furthermore, targeted annotations can identify the precise moments when call volume crosses critical operational thresholds, providing essential context regarding the dual peak periods. Ultimately, a strong recommendation translates these analytical insights into a tangible directive: scheduling lunch breaks or small team meetings during the lulls between the peaks. Each piece of text serves a distinct operational purpose, demonstrating that minimalism should never come at the expense of clarity and utility.
Different Words Do Different Jobs
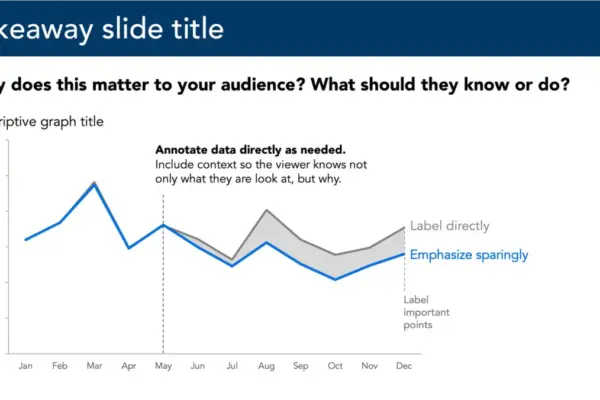
When deciding which textual elements belong on a graph or presentation slide, communicators must first evaluate what their audience requires to decode and act upon the information. A takeaway title can communicate the core message or prompt a specific action, while a descriptive graph title grounds the audience in the metrics being displayed. Direct labels can eliminate the cognitive friction of repeatedly referencing a separate legend, and annotations can explain historical context, highlight anomalies, or draw attention to critical trends that might not be immediately obvious from the visual trajectory alone. Meanwhile, traditional elements such as axis titles, footnotes, and source information provide supplementary detail when deeper verification is necessary.
Not every visualization requires the simultaneous deployment of every textual tool. The overarching objective is deliberate design. Communicators must ask fundamental questions about what their audience needs to fully comprehend the material, what conclusions or actions should result from the presentation, and where a few well-chosen words could eliminate confusion or sharpen the core message. Once these priorities are established, any extraneous text that fails to advance understanding can be safely eliminated.
The Insight Has to Come From Somewhere
This delicate balance between data and narrative highlights the critical role of human expertise, particularly as organizations increasingly experiment with artificial intelligence in content creation and data storytelling.
If an AI tool is provided with raw call-volume data and tasked with generating a presentation slide, it can typically identify the underlying patterns. The algorithm might accurately determine that call volume reaches its highest points around lunchtime and again in the mid-afternoon, subsequently generating a polished sentence to describe that observation.
However, a descriptive sentence is not yet an actionable insight. A truly useful recommendation requires combining raw metrics with broader organizational context: understanding who the audience is, why they are reviewing the data, what outcomes they care about, and which decisions fall within their sphere of control. Once it is established that the viewers are staffing managers, the observed pattern transforms from a simple data point into an actionable operational strategy.
This principle forms the core of modern data storytelling frameworks, emphasizing that human operators must supply the necessary context before asking automated systems to assist with communication. While AI can efficiently refine wording, suggest alternative titles and labels, and test different ways to articulate a concept, a human expert must still understand the underlying business situation well enough to recognize what truly matters.
A polished sentence cannot substitute for genuine insight. Professionals who spend extended periods working closely with specific datasets possess a depth of institutional knowledge that algorithms lack. They understand the organizational history, recognize what operational changes occurred, and know what the audience values. They can discern whether a minor fluctuation in a graph represents a consequential trend or statistical noise.
By bringing this contextual knowledge to the presentation slide, communicators can use words to make their strategic thinking visible. The ultimate objective is neither maximizing nor minimizing the word count, but rather ensuring that the right words are deployed to do the right jobs.