The modern workplace is flooded with data visualizations, dashboards, and automated charts. Yet, professional communicators and data analysts often grapple with a fundamental misunderstanding of what makes a visual effective. A common trap is assuming that minimalism equates to utility—that stripping away all surrounding text leaves behind a cleaner, more impactful graphic. A closer examination of how data is interpreted in professional settings reveals that words are not mere decorations to be minimized; rather, they are the vital connective tissue that transforms raw metrics into actionable insight.
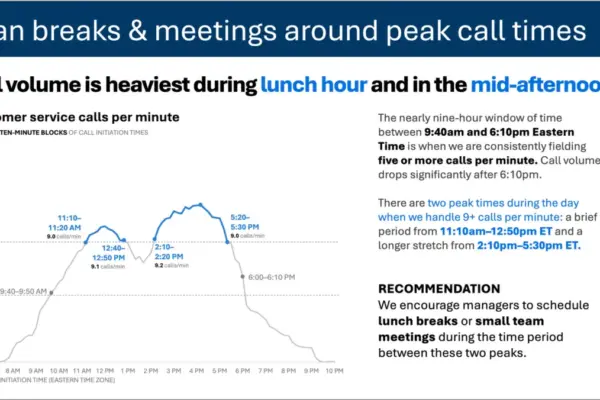
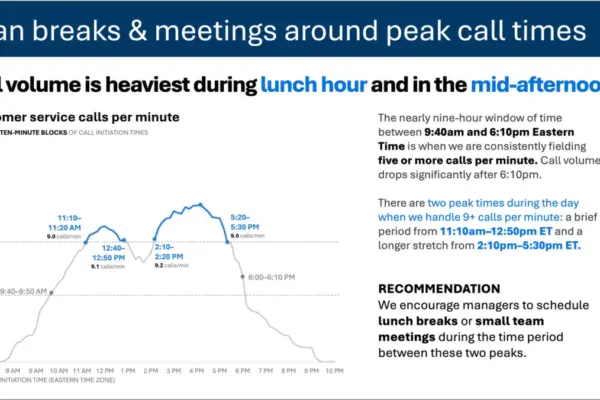
Consider a standard line graph tracking customer service call volume across the span of a single business day. Viewed in a vacuum, the chart presents a straightforward pattern: call rates begin to climb steadily in the morning, remain at elevated levels throughout the bulk of the standard workday, and spike noticeably during two distinct windows—around lunchtime and once again in the mid-afternoon.
On its own, this visualization offers a passive observation of operational trends. However, the nature of the audience fundamentally alters the purpose of the communication. When the viewers of this chart are staffing managers tasked with scheduling, they are not evaluating the data out of idle curiosity. They are looking at the graphic because they have the operational power and responsibility to act upon it. This shift in context alters every strategic choice an effective communicator must make regarding language and design.
Different words do different jobs
Recognizing that an audience needs to act on data changes how text is integrated into a presentation or report. Instead of presenting a chart devoid of context, a well-designed slide uses targeted text elements to serve distinct functional roles.
Rather than relying solely on a generic technical label, the graphic can be anchored by a takeaway title—such as Plan breaks & meetings around peak call times—which immediately signals to staffing managers what matters most in the data. Meanwhile, a precise descriptive graph title, such as Customer service calls per minute, grounds the audience in what they are actually observing.
Strategic annotations can then be deployed to pinpoint the exact moments when call volumes cross critical operational thresholds, providing necessary nuance regarding the two daily surges. Finally, a clear recommendation translates the visual evidence into a concrete operational directive, suggesting that supervisors schedule lunch breaks or internal team meetings precisely between the identified peak periods.
Each piece of text within the layout fulfills a specific responsibility. This reality challenges the pervasive design myth that reducing word counts is always an inherent improvement. Stripping away all contextual text surrounding a graph might yield a superficially minimalist slide, but it ultimately diminishes the utility of the communication. Effective data storytelling requires supplying the right words to guide comprehension and action.
When deciding which textual elements belong on a graph or presentation slide, communicators must evaluate what the audience requires to make sense of the information. Different textual layers serve specialized functions within the visual hierarchy.
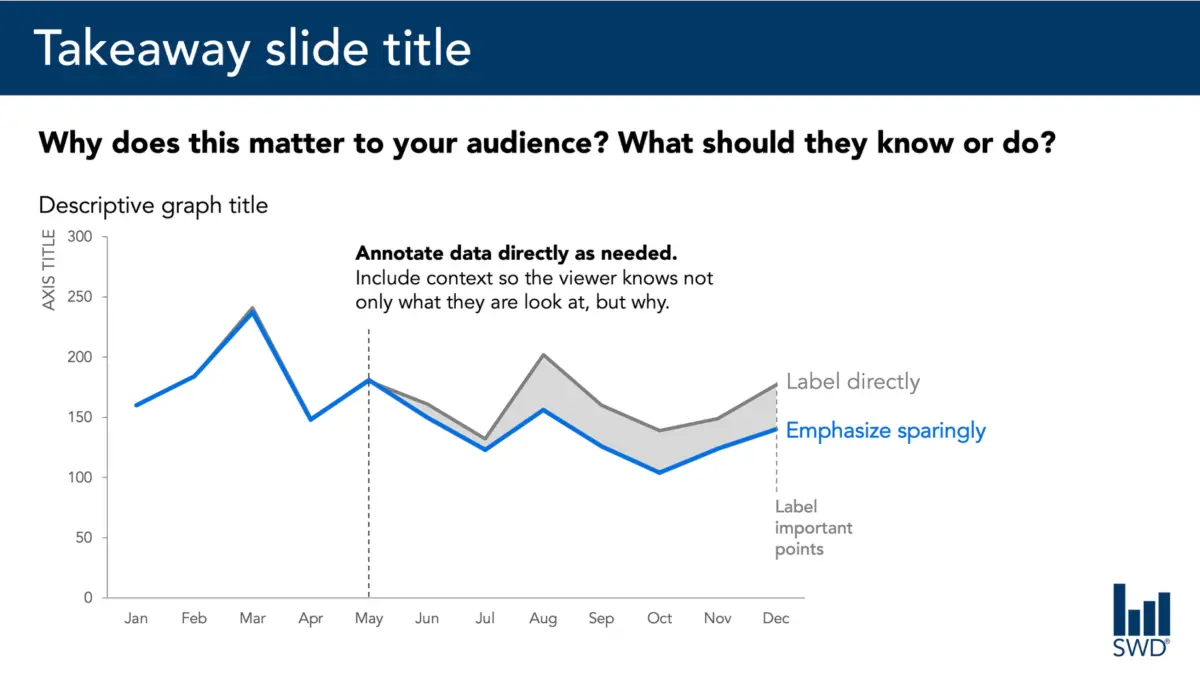
A takeaway title communicates the core message or recommended action directly to the viewer. A descriptive graph title establishes the baseline orientation, ensuring the audience immediately understands the parameters of the data display. Direct data labels can remove the cognitive friction of repeatedly shifting the eye back and forth between the primary graphic and a distant legend. Annotations explain historical events, draw attention to anomalies, or supply vital context that remains invisible within the numbers alone. Standard supplementary elements such as axis titles, footnotes, and formal source citations provide the granular detail required for rigorous scrutiny.
Crucially, not every graph requires every single one of these components. The objective is deliberate curation. Communicators must ask probing questions about their audience: What do these individuals need to comprehend this graphic? What should they know or do as a direct result of viewing it? Where can a handful of well-chosen words eliminate ambiguity or render the core takeaway unmistakable? Once these priorities are established, any extraneous words that fail to advance the message should be systematically removed.
The insight has to come from somewhere
This nuanced balance between visual design and strategic language highlights why the human element remains indispensable, particularly in an era defined by the rapid adoption of artificial intelligence in the workplace.
Imagine feeding the aforementioned customer service call volume dataset into an AI tool and prompting it to generate a slide layout. The technology is entirely capable of identifying the underlying mathematical pattern. It can readily deduce that call frequencies peak around lunchtime and mid-afternoon, and it can synthesize that observation into a polished, grammatically correct sentence.
Yet, a polished sentence is not synonymous with a genuine insight.
True, actionable recommendations emerge only when raw data is synthesized with broader institutional context. Generating an effective strategy requires knowing the specific audience, understanding their operational constraints, recognizing their core priorities, and identifying which decisions fall squarely within their sphere of control. Once the system or the analyst knows that the end users are staffing managers, a standard cyclical pattern transitions into a practical framework for action.
This principle forms the cornerstone of modern data communication frameworks: artificial intelligence can assist significantly with drafting concise wording, suggesting alternative titles, formatting labels, and testing different ways to articulate a concept. However, a human operator must understand the operational reality well enough to discern what truly matters.
Professionals who spend extended periods working closely with specific data possess institutional memory that automated systems lack. They know the corporate history, they understand recent policy or environmental shifts, and they are acutely aware of the nuances that matter to their stakeholders. A seasoned professional might recognize that a minor upward movement in a data series is actually a critical warning sign, whereas a visually prominent spike elsewhere in the same chart is merely a temporary, expected anomaly.
Integrating this institutional knowledge into a visual presentation requires making analytical thinking visible through carefully chosen language. The ultimate objective in data communication is neither an arbitrary maximum nor a minimalist minimum of text. Success lies in deploying the exact right words to execute the necessary jobs, ensuring that data is not merely seen, but fully understood and acted upon.