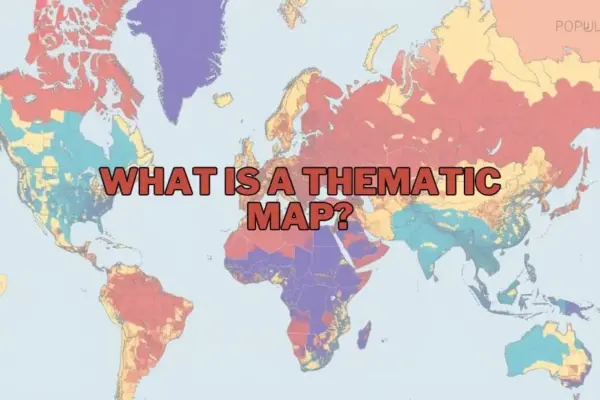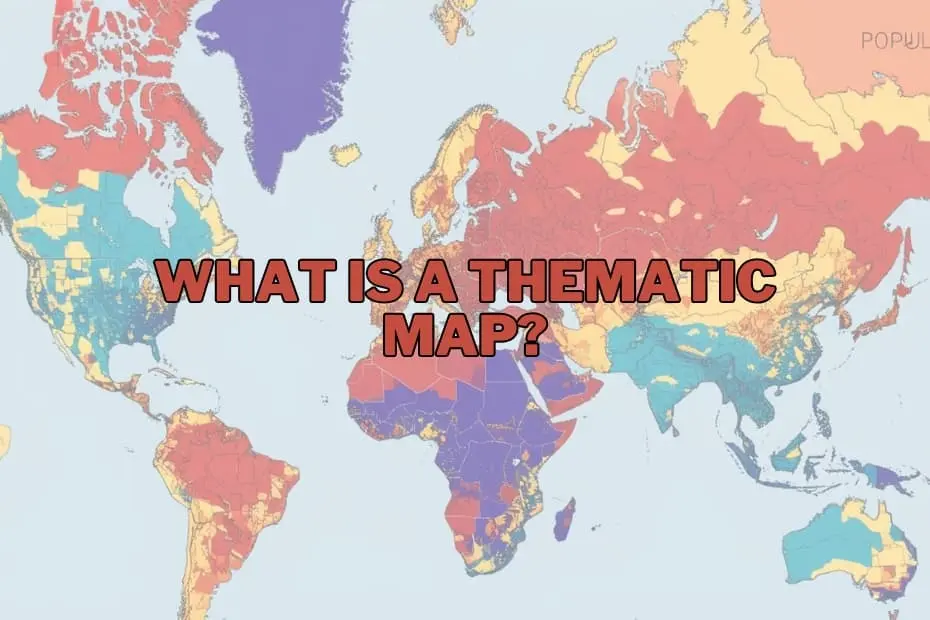
In an era increasingly defined by data, maps have evolved far beyond their traditional role as basic navigational tools. While early cartography focused primarily on helping travelers move from one physical location to another, modern geographic visualization serves a much broader purpose: unearthing hidden patterns, illustrating complex relationships, and translating vast datasets into intuitive visual narratives. At the center of this transition is the thematic map, a specialized graphic instrument designed to portray spatial variations of specific phenomena across defined geographic boundaries.
Unlike general reference maps, which prioritize structural geography such as roads, rivers, topographical contours, and municipal boundaries, thematic maps concentrate on a single subject or narrative. Whether illustrating regional population density, tracking shifts in global climate patterns, or mapping local economic activity, thematic maps allow researchers, policymakers, and business analysts to grasp abstract numbers through a geographic lens.
By converting raw tabular data into accessible visual structures, thematic mapping has established itself as an indispensable tool across public health, environmental monitoring, urban planning, and commercial strategy. Understanding the structure, methodologies, and applications of thematic mapping highlights how spatial intelligence continues to shape decision-making in the modern world.
Defining the Core Purpose and Value of Thematic Mapping
The fundamental purpose of a thematic map is to communicate spatial information clearly and efficiently. Raw data presented in extensive spreadsheets or complex statistical summaries can easily obscure critical trends. When that same information is tied to geographic coordinates and rendered visually, underlying spatial distributions, clusters, and anomalies immediately come to light.
Thematic maps excel at demonstrating relationships that might otherwise remain unseen. In environmental science, for example, a thematic map can illustrate the direct spatial overlay between rising average temperatures and declining agricultural output, giving researchers immediate clarity on regional vulnerabilities. In municipal governance, urban planners utilize thematic maps to analyze demographic shifts, tracking how localized population growth affects existing public transit networks, healthcare accessibility, and housing infrastructure.
The importance of thematic cartography lies in its capacity to simplify complexity without stripping away essential context. By converting numerical values into visual variables—such as varying color intensities, dynamic symbol sizes, or density dots—these maps establish a common visual language. This makes spatial patterns easily interpretable not only for specialized geographers, but also for corporate decision-makers, community leaders, and the general public.
Key Types of Thematic Maps and Their Methodologies
Because different datasets possess unique structural characteristics, cartographers rely on distinct types of thematic maps to represent specific phenomena. Selecting the appropriate map format depends entirely on whether the underlying data is qualitative or quantitative, continuous across space, or tied to discrete administrative boundaries.
Choropleth Maps
Choropleth maps are among the most frequently utilized formats in spatial visualization. These maps apply varying shades of color or pattern fill to predefined geographic areas, such as countries, states, counties, or census tracts. The intensity of the color corresponds directly to the statistical value associated with each region, making choropleth maps particularly effective for visualizing standardized quantitative data like literacy rates, median household income, or population density. However, because choropleth maps rely on aggregated regional boundaries, they assume uniform distribution within each zone, requiring careful data classification to avoid misleading visual impressions.
Isoline (Isopleth) Maps
Isoline maps utilize continuous lines to connect geographic points that share equal numerical values. This approach is ideally suited for visualizing continuous spatial phenomena that flow smoothly across landmasses without respecting artificial administrative boundaries. Common examples include weather maps displaying atmospheric pressure (isobars), precipitation patterns (isohyets), or temperature variations (isotherms). Isoline maps allow analysts to visualize smooth spatial trends and environmental gradients across broad regions.
Graduated and Proportional Symbol Maps
When visual data is anchored to specific geographic locations or region centroids rather than entire filled areas, graduated symbol maps provide an effective alternative. These maps utilize shapes—most commonly circles or squares—placed at specific coordinates. The visual size of each symbol scales proportionally according to the quantitative value it represents. For example, a graduated symbol map might display municipal airports with circle sizes scaled according to annual passenger traffic, or urban centers scaled by total industrial output.
Dot Density Maps
Dot density maps represent spatial distributions by using individual dots or uniform symbols across a mapped region. In these maps, a single dot can represent a precise occurrence of a phenomenon or a specific aggregated quantity (for instance, one dot representing 1,000 residents). Dot density maps are highly effective for illustrating visual concentration, spatial dispersion, and regional density variations without relying on the uniform boundary shading typical of choropleth mapping.
Cartograms and Qualitative Maps
Cartograms intentionally distort physical geography to emphasize statistical variables. In a cartogram, land areas are rescaled so that physical size directly reflects a chosen attribute, such as national gross domestic product or total population. Conversely, qualitative thematic maps focus on categorized data rather than numerical measurements, using distinct colors or symbols to mark differing land-use classifications, geological formations, or dominant language regions.
Key Elements of Effective Cartographic Design
Designing an effective thematic map requires a balanced integration of aesthetic principles, visual hierarchy, and analytical precision. A well-constructed map must guide the reader’s eyes seamlessly while providing accurate context for the underlying data. To achieve this balance, cartographers rely on several fundamental structural elements:
- Clear and Descriptive Titles: A precise title immediately informs the audience of the subject, geographic scope, and time frame of the mapped data.
- Comprehensive Legends: The map legend serves as the structural decoder, defining color ramps, symbol meanings, unit scales, and data intervals.
- Map Scale and Orientation: Spatial scale indicators and compass rose elements establish geographic context, ensuring that distance and orientation are properly understood.
- Thoughtful Symbology and Color Schemes: Color choices must align with the nature of the data. Sequential color ramps suit ordered numerical data, divergent color schemes highlight deviations from a baseline, and qualitative palettes distinguish distinct categories.
- Data Sources and Attribution: Transparent documentation regarding dataset origin, collection dates, and cartographic methodology builds trust and maintains scientific integrity.
Diverse Applications Across Professional Disciplines
The utility of thematic mapping extends far beyond academic geography. In public health, spatial epidemiology heavily relies on thematic maps to monitor disease outbreaks, track transmission clusters, and identify underserved communities lacking adequate healthcare facilities. Mapping health metrics geographically allows emergency responders and public agencies to deploy critical resources where they are needed most.
In the corporate world, commercial strategy and market research rely heavily on spatial analytics. Retail chains, financial institutions, and real estate developers utilize thematic maps to analyze consumer demographics, household spending habits, and competitor density. Visualizing market saturation spatially helps executive teams identify viable locations for expansion while mitigating financial risks.
Environmental science and resource management also depend on thematic maps to track ecological health, monitor deforestation rates, chart wildlife migration corridors, and assess coastal vulnerability to climate impacts. Furthermore, public policy officials and municipal leaders use thematic maps to guide zoning decisions, evaluate infrastructure demands, and model emergency evacuation routes during natural disasters.
Analytical Advantages and Inherent Limitations
While thematic maps offer substantial analytical value, cartographers and analysts must evaluate their strengths against inherent visual limitations.
Advantages
The primary advantage of thematic maps is their exceptional ability to make complex spatial datasets immediately accessible. By converting dense statistical tables into intuitive visual formats, these maps accelerate data interpretation and pattern recognition. They allow diverse audiences to observe spatial clustering, regional disparities, and geographical trends at a glance. Additionally, thematic maps provide a universal platform for cross-disciplinary collaboration, allowing scientists, public officials, and community members to evaluate shared data on common ground.
Limitations
Despite their utility, thematic maps can introduce visual distortion or misinterpretation if designed improperly. A primary challenge stems from data aggregation across arbitrary administrative boundaries. In a choropleth map, shading an entire large county based on an average metric can obscure localized poverty pockets or rural-urban variations—a phenomenon closely tied to spatial generalization.
Additionally, poor choice of color scales or improper data classification intervals can inadvertently dramatize minor statistical differences or hide significant variances. Analysts must maintain high cartographic standards to ensure visual representation remains faithful to the underlying data.
The Modern Software Ecosystem for Spatial Mapping
Creating high-impact thematic maps has become increasingly accessible thanks to sophisticated desktop and cloud-based software platforms. Modern Geographic Information Systems (GIS) allow users to integrate, analyze, and visualize spatial data with high precision.
- Professional GIS Software: Platforms such as QGIS—an open-source GIS application—and Esri ArcGIS offer comprehensive tools for spatial analysis, precise cartographic editing, and advanced vector data management. QGIS remains an accessible choice for beginners and non-profit organizations, while ArcGIS serves as an industry standard across government and academic institutions.
- Data Visualization Platforms: Analytics platforms like Tableau enable users to generate interactive thematic maps alongside standard business intelligence dashboards, connecting relational databases directly to geographic layers.
- Web Mapping Tools: Lightweight web mapping platforms allow developers and researchers to build dynamic, interactive spatial visualizers tailored for web browsers and mobile platforms.
Choosing the right tool depends on data complexity, software accessibility, and the intended audience. While entry-level mapping tools facilitate quick analytical overviews, dedicated GIS software remains essential for advanced spatial modeling and multi-layered geographic research.
Spatial Intelligence in Historical and Future Contexts
Thematic mapping has a rich historical lineage, famously demonstrated by historical spatial studies such as Dr. John Snow’s 1854 cholera map of London, which pinpointed disease clusters around specific public water pumps. Today, thematic maps operate on vastly larger scales, incorporating historical data to model geographic shifts over time, such as multi-decade demographic transitions or long-term climate alterations.
As spatial data collection accelerates through real-time mobile tracking, satellite remote sensing, and connected Internet of Things (IoT) infrastructure, the role of thematic mapping will only expand. By bridging the gap between raw quantitative information and visual spatial reasoning, thematic maps continue to empower researchers, governments, and organizations to navigate complex global challenges with clarity and insight.