The layout of a presentation slide, encompassing the precise placement of a graph, the proportional allocation of space for supporting text, and the overarching visual hierarchy, is far more than a mere aesthetic choice. It is fundamentally a communication choice. When an author or analyst gets this architecture right, the audience is able to follow the underlying logic effortlessly, absorbing complex trends and insights without friction. Conversely, when the layout is neglected or poorly executed, even the most meticulously designed and insightful graphs can leave an audience disoriented, confused, and ultimately missing the core takeaway.
To address this common stumbling block in data storytelling, communication experts often turn to a guiding principle known as vertical logic. This concept posits that all information presented on a given slide should be entirely self-reinforcing. In a truly vertically logical slide, the content reinforces the title, and the title in turn frames the content. The accompanying words reinforce the visual graphic, while the visual graphic instantly validates the words. There is nothing extraneous, nothing out of place, and nothing that feels unrelated to the core narrative. Instead, the design creates a clear, seamless flow where a reader or viewer’s understanding deepens progressively with every single element they encounter. This foundational concept, alongside its companion principle known as horizontal logic, is explored extensively in professional resources such as the book storytelling with data.
Building directly upon these principles, communication specialists and corporate trainers continue to expand on how theory translates into everyday professional practice. In the book storytelling with data: before & after, authored by industry experts including Mike Cisneros, professionals are introduced to practical, go-to layouts designed specifically to bring vertical logic to life on corporate slides and presentations. The framework and examples provided in these resources illustrate that effective data communication relies heavily on structured visual storytelling.
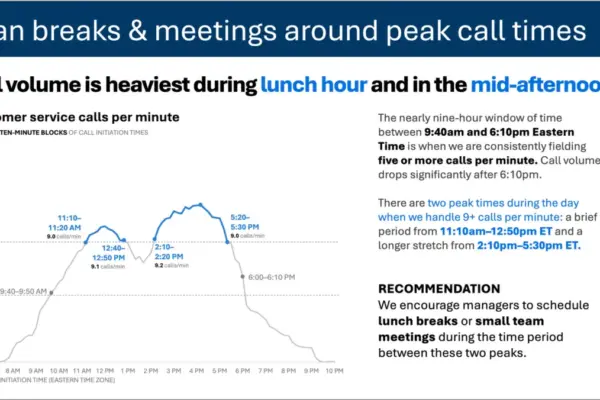
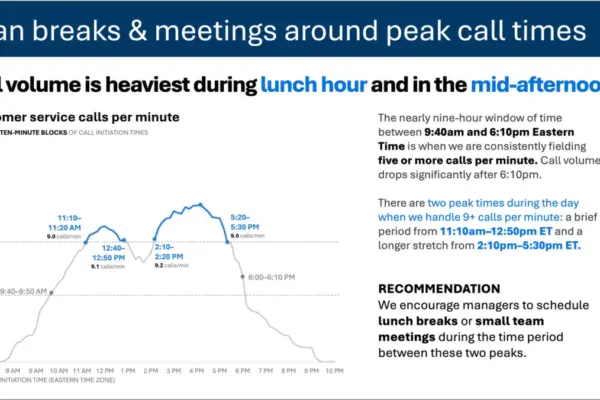
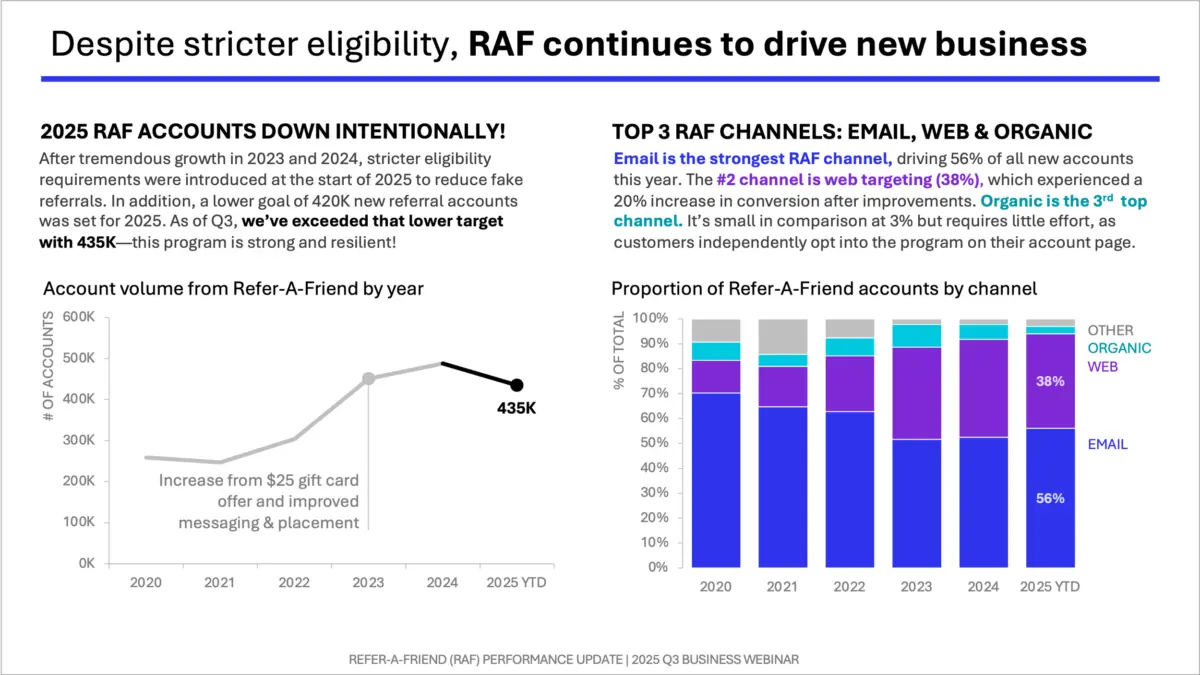
One of the primary frameworks highlighted in these resources is the one-sided layout, a structured approach designed to maximize the impact of a single visual. In this configuration, a single, powerful graph is given a large, prominent position on the slide, paired with dedicated space for explanatory text running across the top and down the right-hand side. This specific spatial arrangement deliberately leverages what cognitive psychologists refer to as the picture superiority effect. Extensive research into human cognition demonstrates that people notice images significantly faster, understand them more intuitively, and retain them in memory much longer than they do blocks of text alone.
By utilizing the one-sided layout, a presenter can lead firmly with the visual element, allowing the graph to do the heavy lifting of communicating the core trend or finding. The surrounding text is then strategically deployed to frame the message, provide necessary context, and reinforce the primary takeaway without competing for the viewer’s initial attention. In professional environments, this structure proves particularly effective for delivering concise, high-stakes recommendations, such as driving marketing strategies or outlining operational pivots. By anchoring the visual on one side and supporting it with targeted text, presenters can guide their audience smoothly from initial observation to complete comprehension, ensuring that the data truly drives the intended business decision.