Emissions resulting from land-use changes—encompassing deforestation, the degradation of forests, and the loss of vital peatlands—have experienced a notable and sustained decline over the course of the 21st century. According to the latest findings from the Global Carbon Budget report, formally published in the journal Earth System Science Data, researchers have documented a statistically significant decrease in net carbon dioxide emissions from land-use change since the late 1990s.
This long-term downward trajectory has notably accelerated in recent years. Climate scientists Dr. Zeke Hausfather and Professor Pierre Friedlingstein, writing in an analysis for Carbon Brief, pointed out that land-use emissions in 2025 dropped by approximately 32% compared to the baseline average recorded throughout the 2000s. While global emissions originating from fossil fuels and cement manufacturing have continued their relentless march upward, the cooling effect of declining land-use emissions has provided a vital, albeit partial, counterweight in the global carbon cycle.
Understanding how and why land-use emissions have fallen over the past quarter-century requires looking closely at the complex interplay of human activity, international policy shifts, and natural climate phenomena.
How Have Land-Use Emissions Changed?
Human activities that alter landscapes—such as clearing forests for agriculture, harvesting trees for timber, draining peatlands, and degrading ecosystems through edge effects—release vast quantities of stored carbon back into the atmosphere. Collectively, these are categorized as land-use, land-use change, and forestry emissions, commonly referred to simply as land-use emissions.
Annually, these trends are meticulously compiled and analyzed by the Global Carbon Budget initiative, a collaborative effort involving dozens of international scientists who document the evolving trajectory of human-caused greenhouse gas emissions. Key findings from the research are released in the autumn before undergoing formal peer review and academic publication the following year.
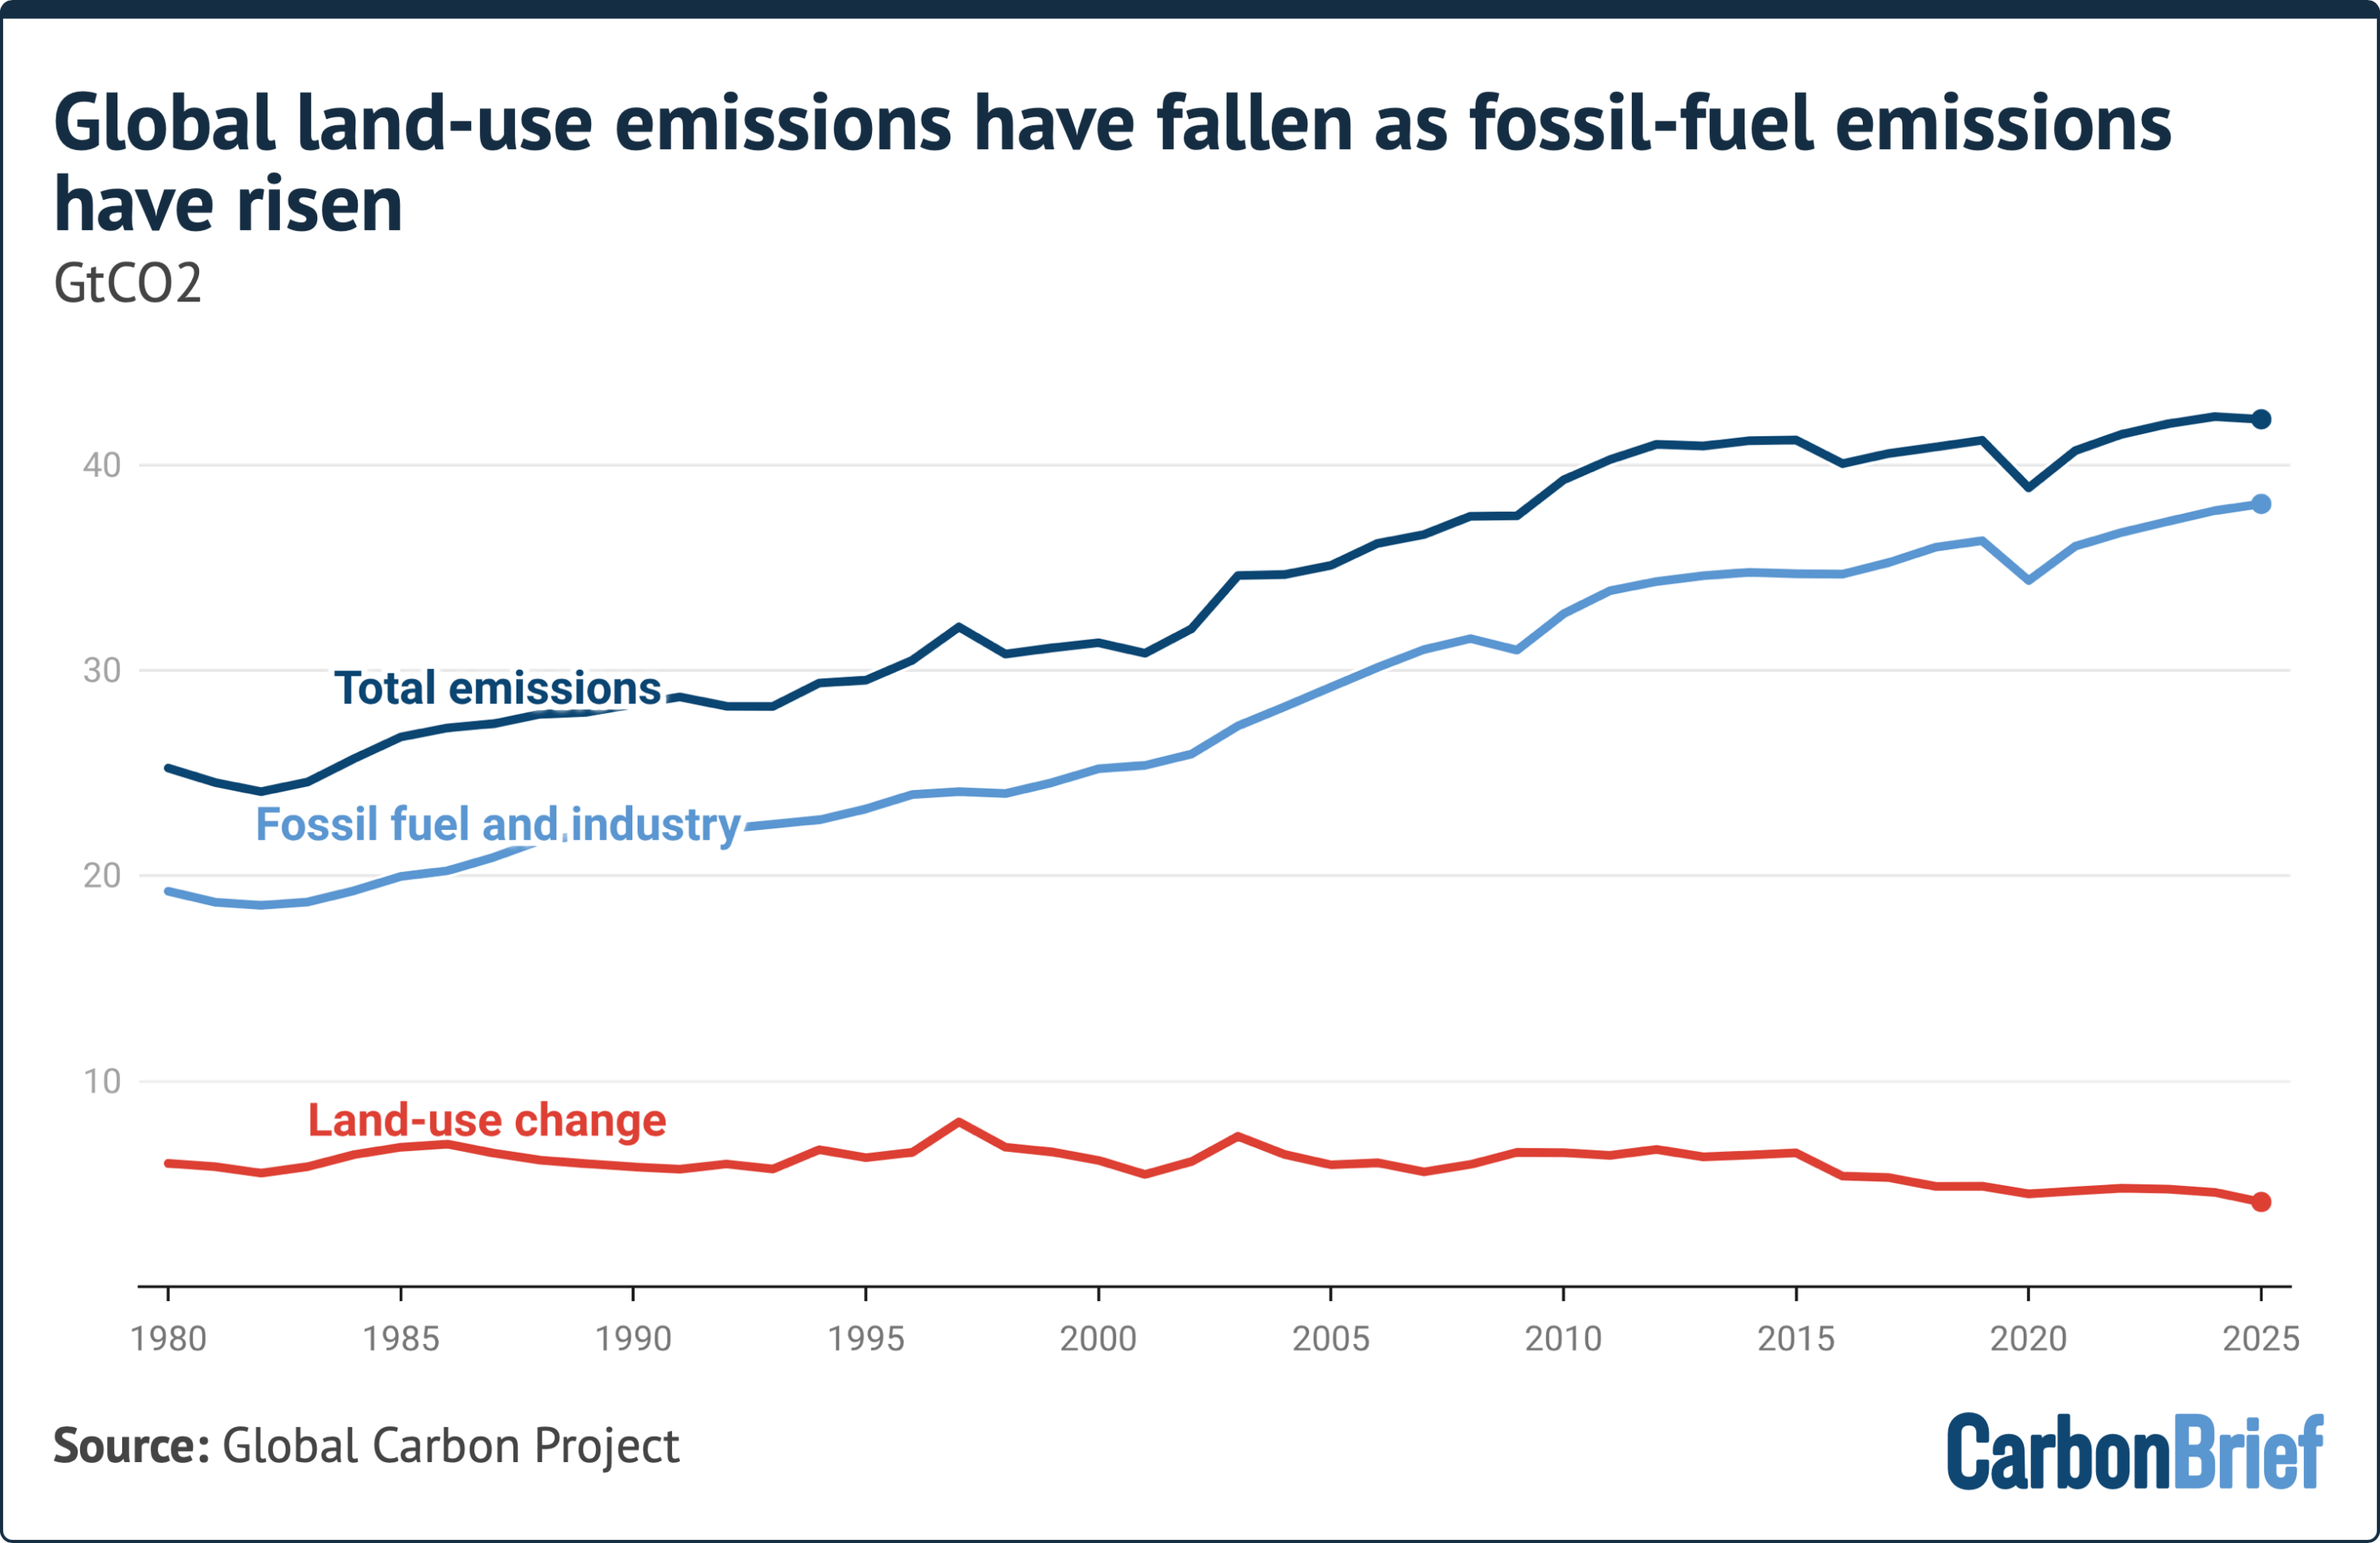
Historical data from the report indicates that for the four decades leading up to 1999, net carbon dioxide emissions from land-use change remained relatively stable, hovering around 6.6 billion tonnes of carbon dioxide per year. However, the turn of the millennium marked a turning point. The 2025 report estimates that land-use emissions across the decade spanning 2015 to 2024 averaged 5 billion tonnes of carbon dioxide annually. This represents a 23% reduction compared to the 1995–2004 average and a 19% drop relative to the 2005–2014 decade.
In sharp contrast, global emissions from fossil fuels and cement have climbed every single decade since 1959. Moving from an average of 11 billion tonnes in the 1960s, fossil emissions surged to an average of 35.9 billion tonnes annually over the 2015–2024 period. Preliminary data for 2025 suggests that land-use emissions ticked down further to 4.1 billion tonnes, while fossil fuel and cement emissions climbed to a historic new high of 38.1 billion tonnes.
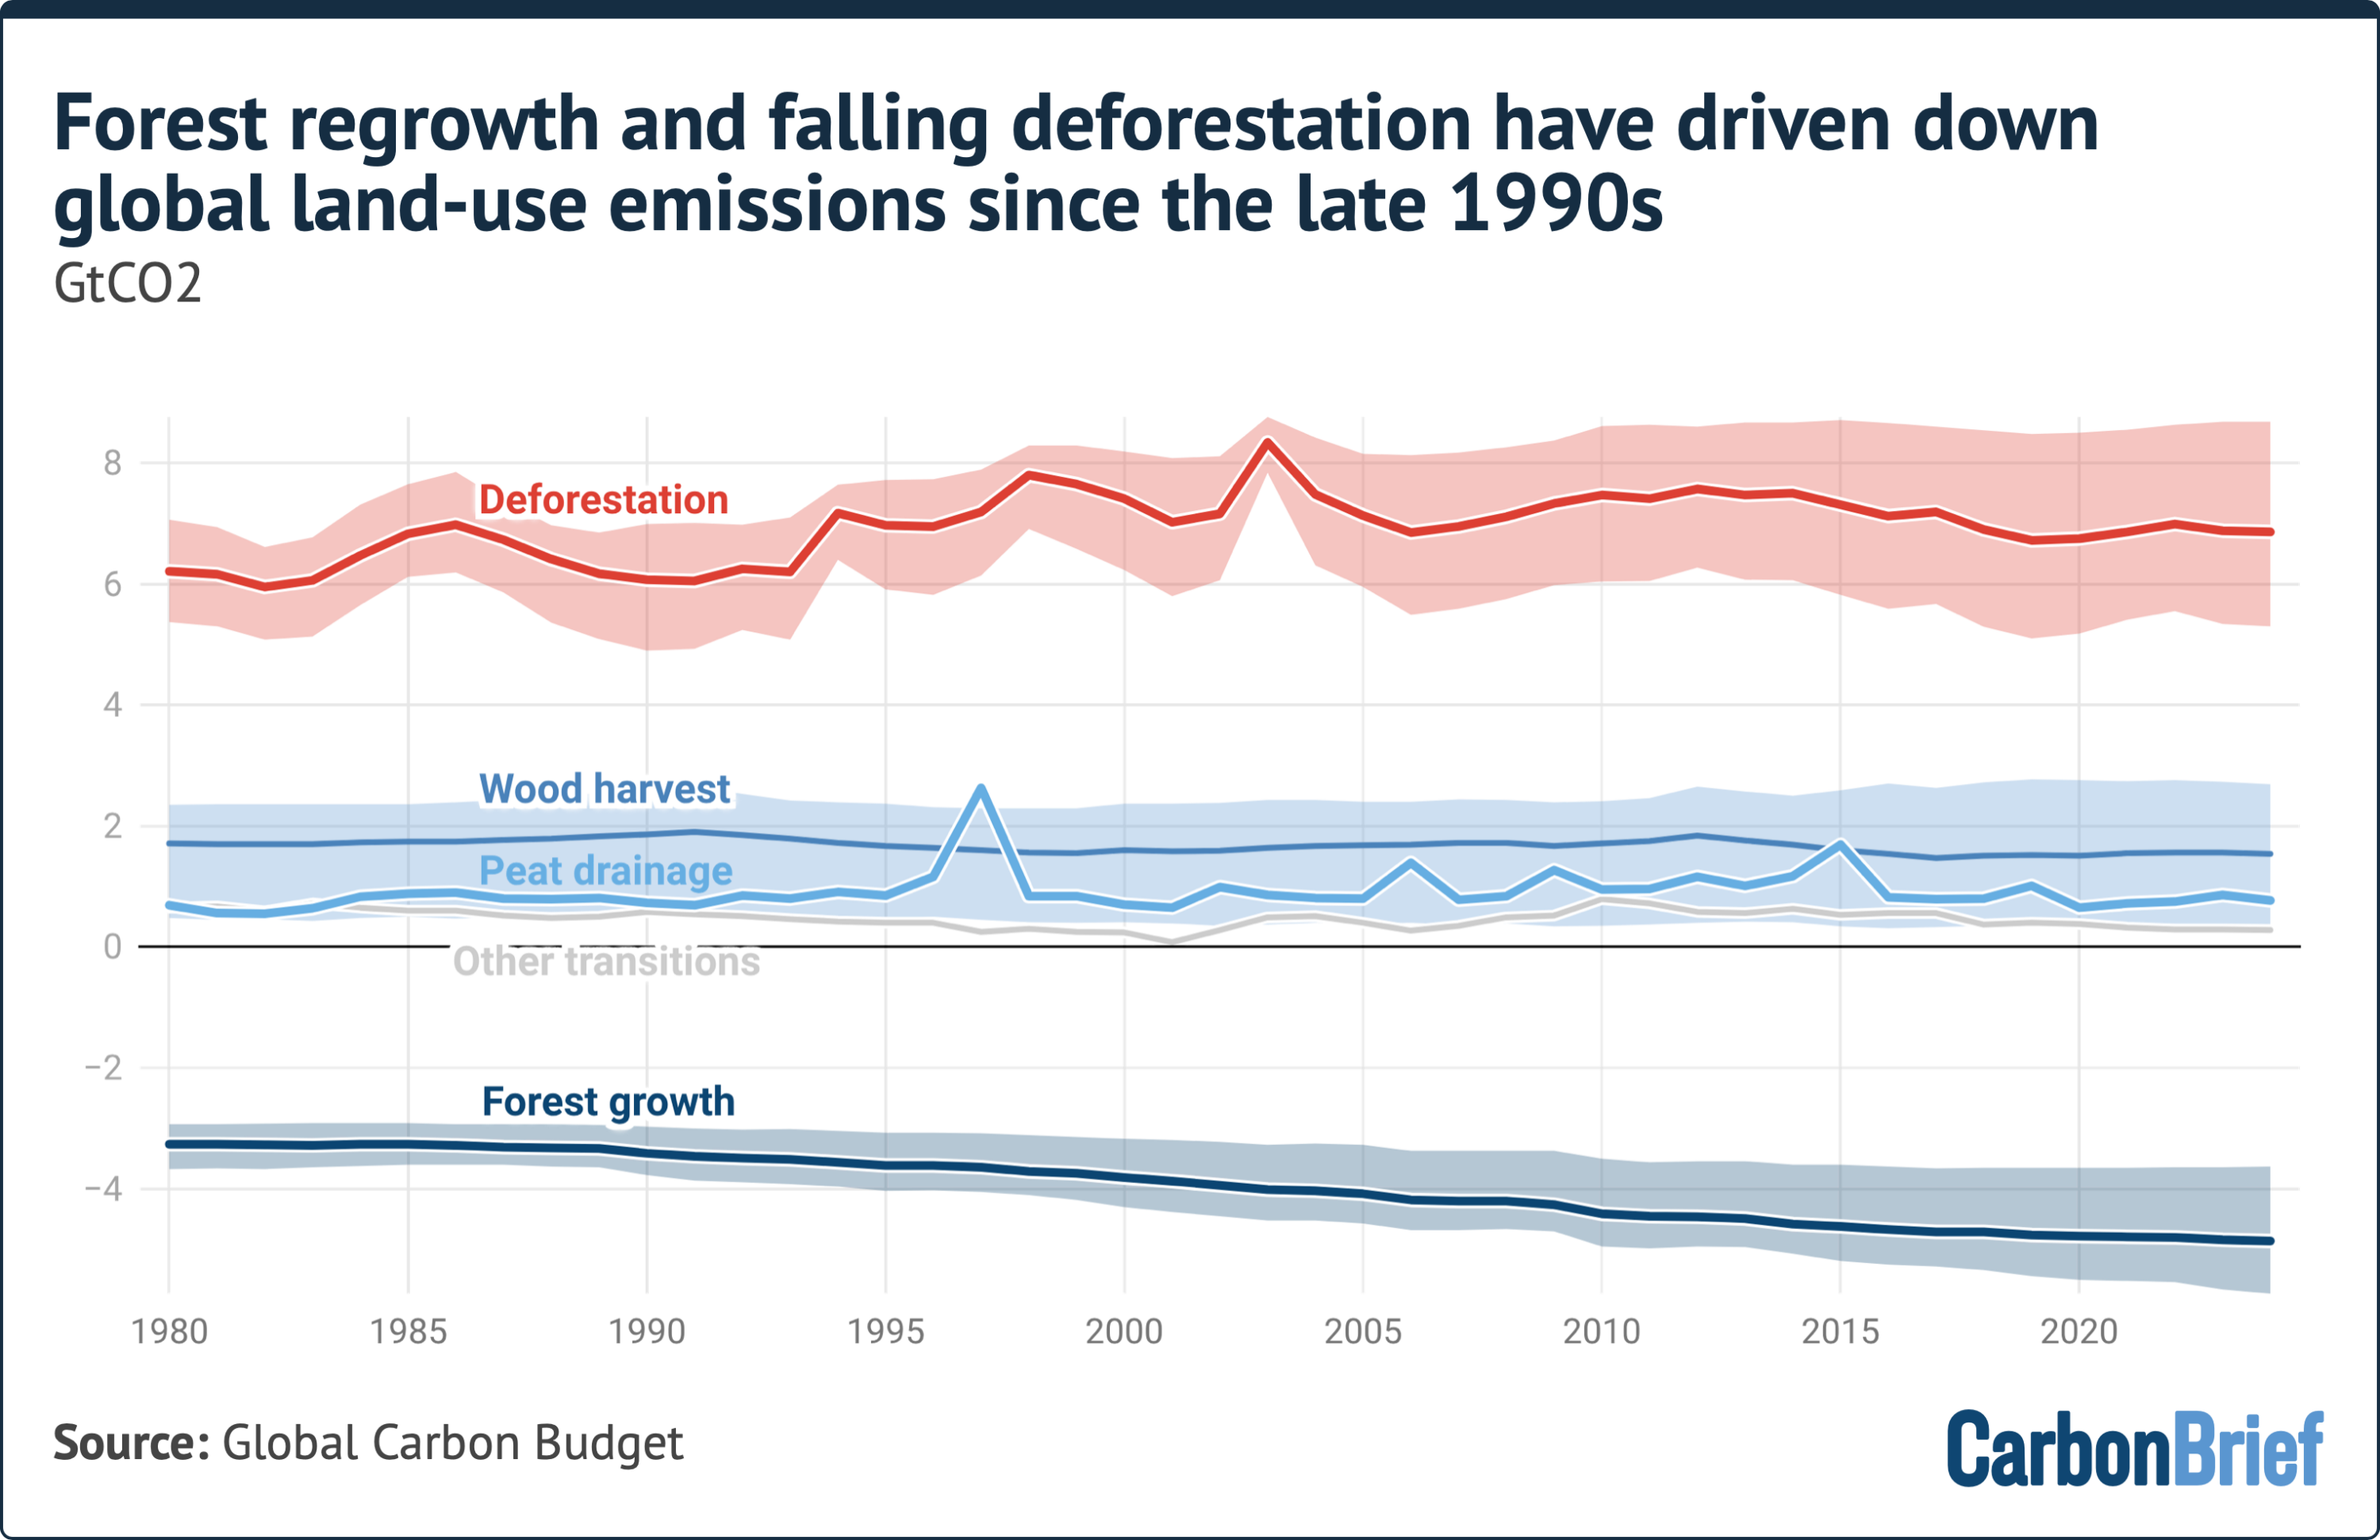
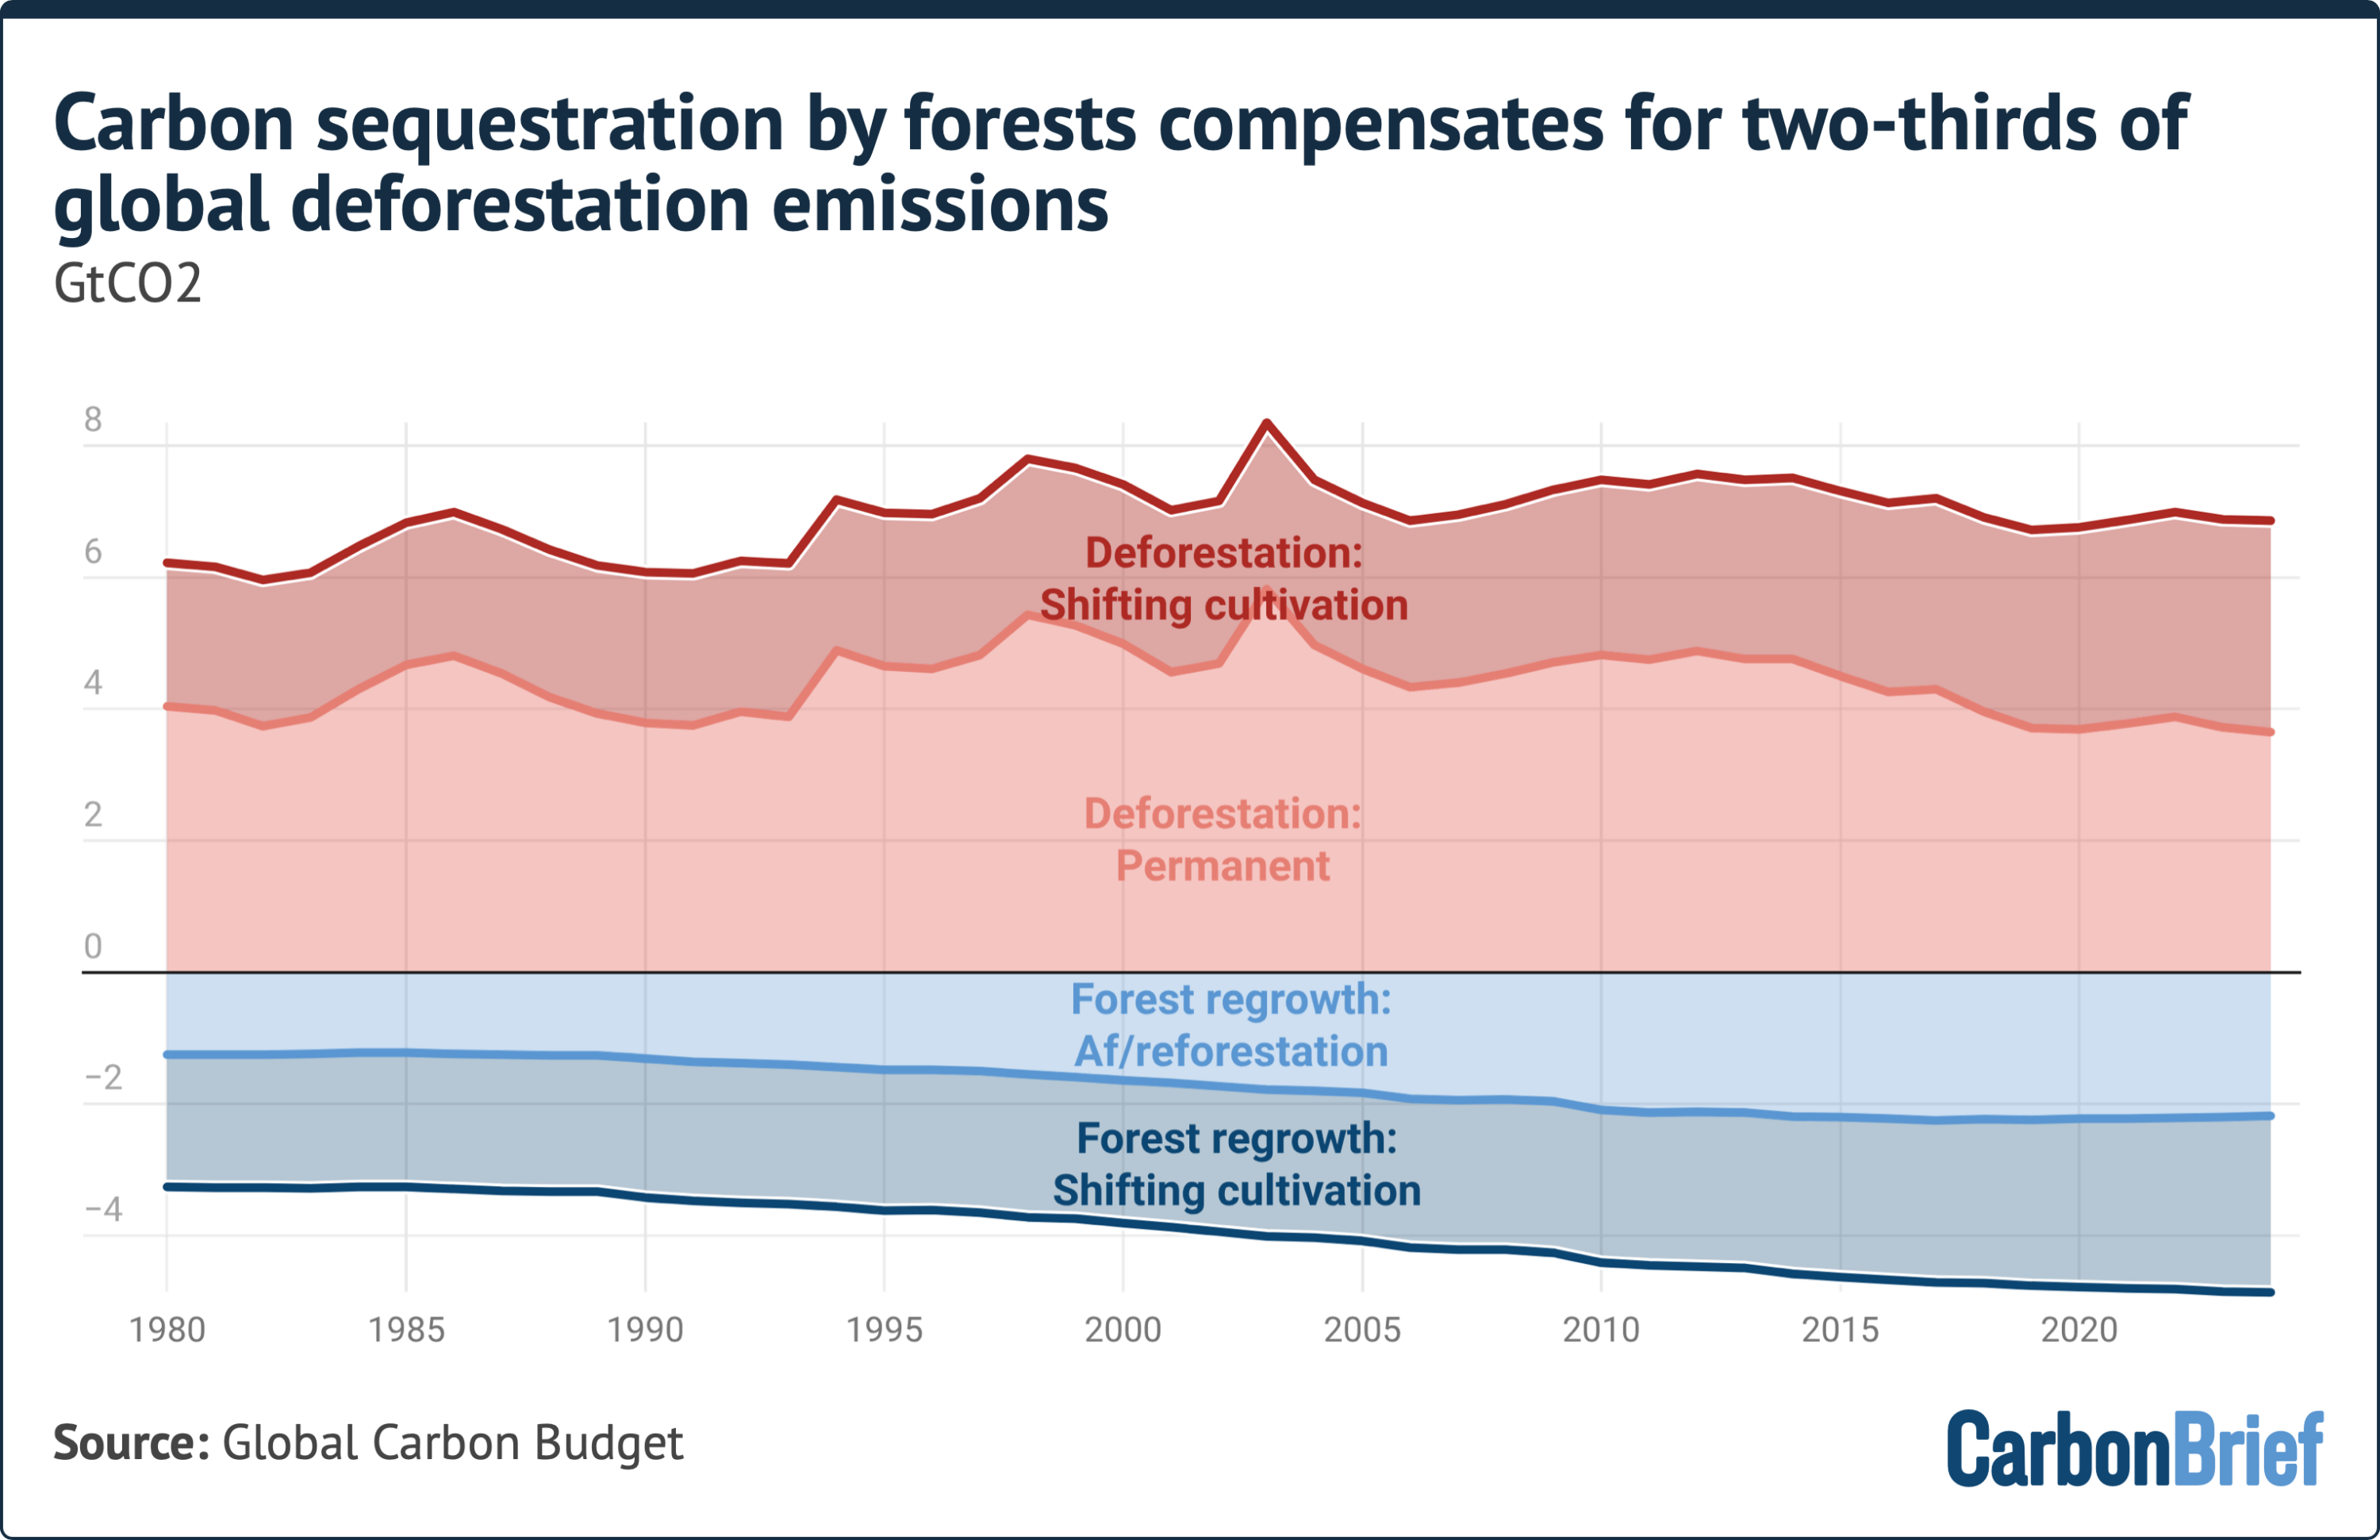
The Global Carbon Budget attributes the ongoing reduction in land-use emissions largely to a decrease in permanent deforestation. Permanent deforestation involves the complete clearing of forest canopy to convert land permanently into agricultural plots, mining operations, or urban infrastructure. This is distinct from temporary or rotational forestry practices, such as selective logging or shifting cultivation cycles, where canopy removal is not meant to be permanent. Furthermore, increasing carbon dioxide removals driven by forest regrowth have bolstered the downward trend.
Data indicates that between 2015 and 2024, the natural sequestration of carbon through reforestation and afforestation initiatives successfully offset roughly two-thirds of total global deforestation emissions. While deforestation contributed an average of 6.96 billion tonnes of carbon dioxide per year over that decade, forest growth managed to remove 4.76 billion tonnes annually. Just under half of these removals stemmed from active afforestation and reforestation programs, with the remainder driven by natural forest recovery following shifting cultivation cycles—a traditional farming practice where exhausted agricultural plots are abandoned to let the forest regenerate.
Near-term projections also point to climatic factors. The anticipated drop in land-use emissions between 2024 and 2025 is partly linked to the waning of El Niño conditions. Naturally occurring El Niño cycles typically dry out tropical peatlands and cause planned agricultural or deforestation fires to burn out of control, whereas neutral or cooler phases temper these disastrous spikes.
Professor Pierre Friedlingstein, director of the Global Carbon Budget office and a researcher at the University of Exeter, notes that while the future remains uncertain, the overarching 21st-century trend is moving in the right direction. He emphasizes that if current global land policies hold, deforestation rates should continue their downward trajectory, though predicting exact future pathways remains difficult.
Which Countries Are Behind Falling Land-Use Emissions?
Geographically, the vast majority of global land-use emissions are concentrated in just a few regions. According to the Global Carbon Budget, Brazil, the Democratic Republic of the Congo (DRC), and Indonesia accounted for 57% of all global land-use emissions between 2015 and 2024.
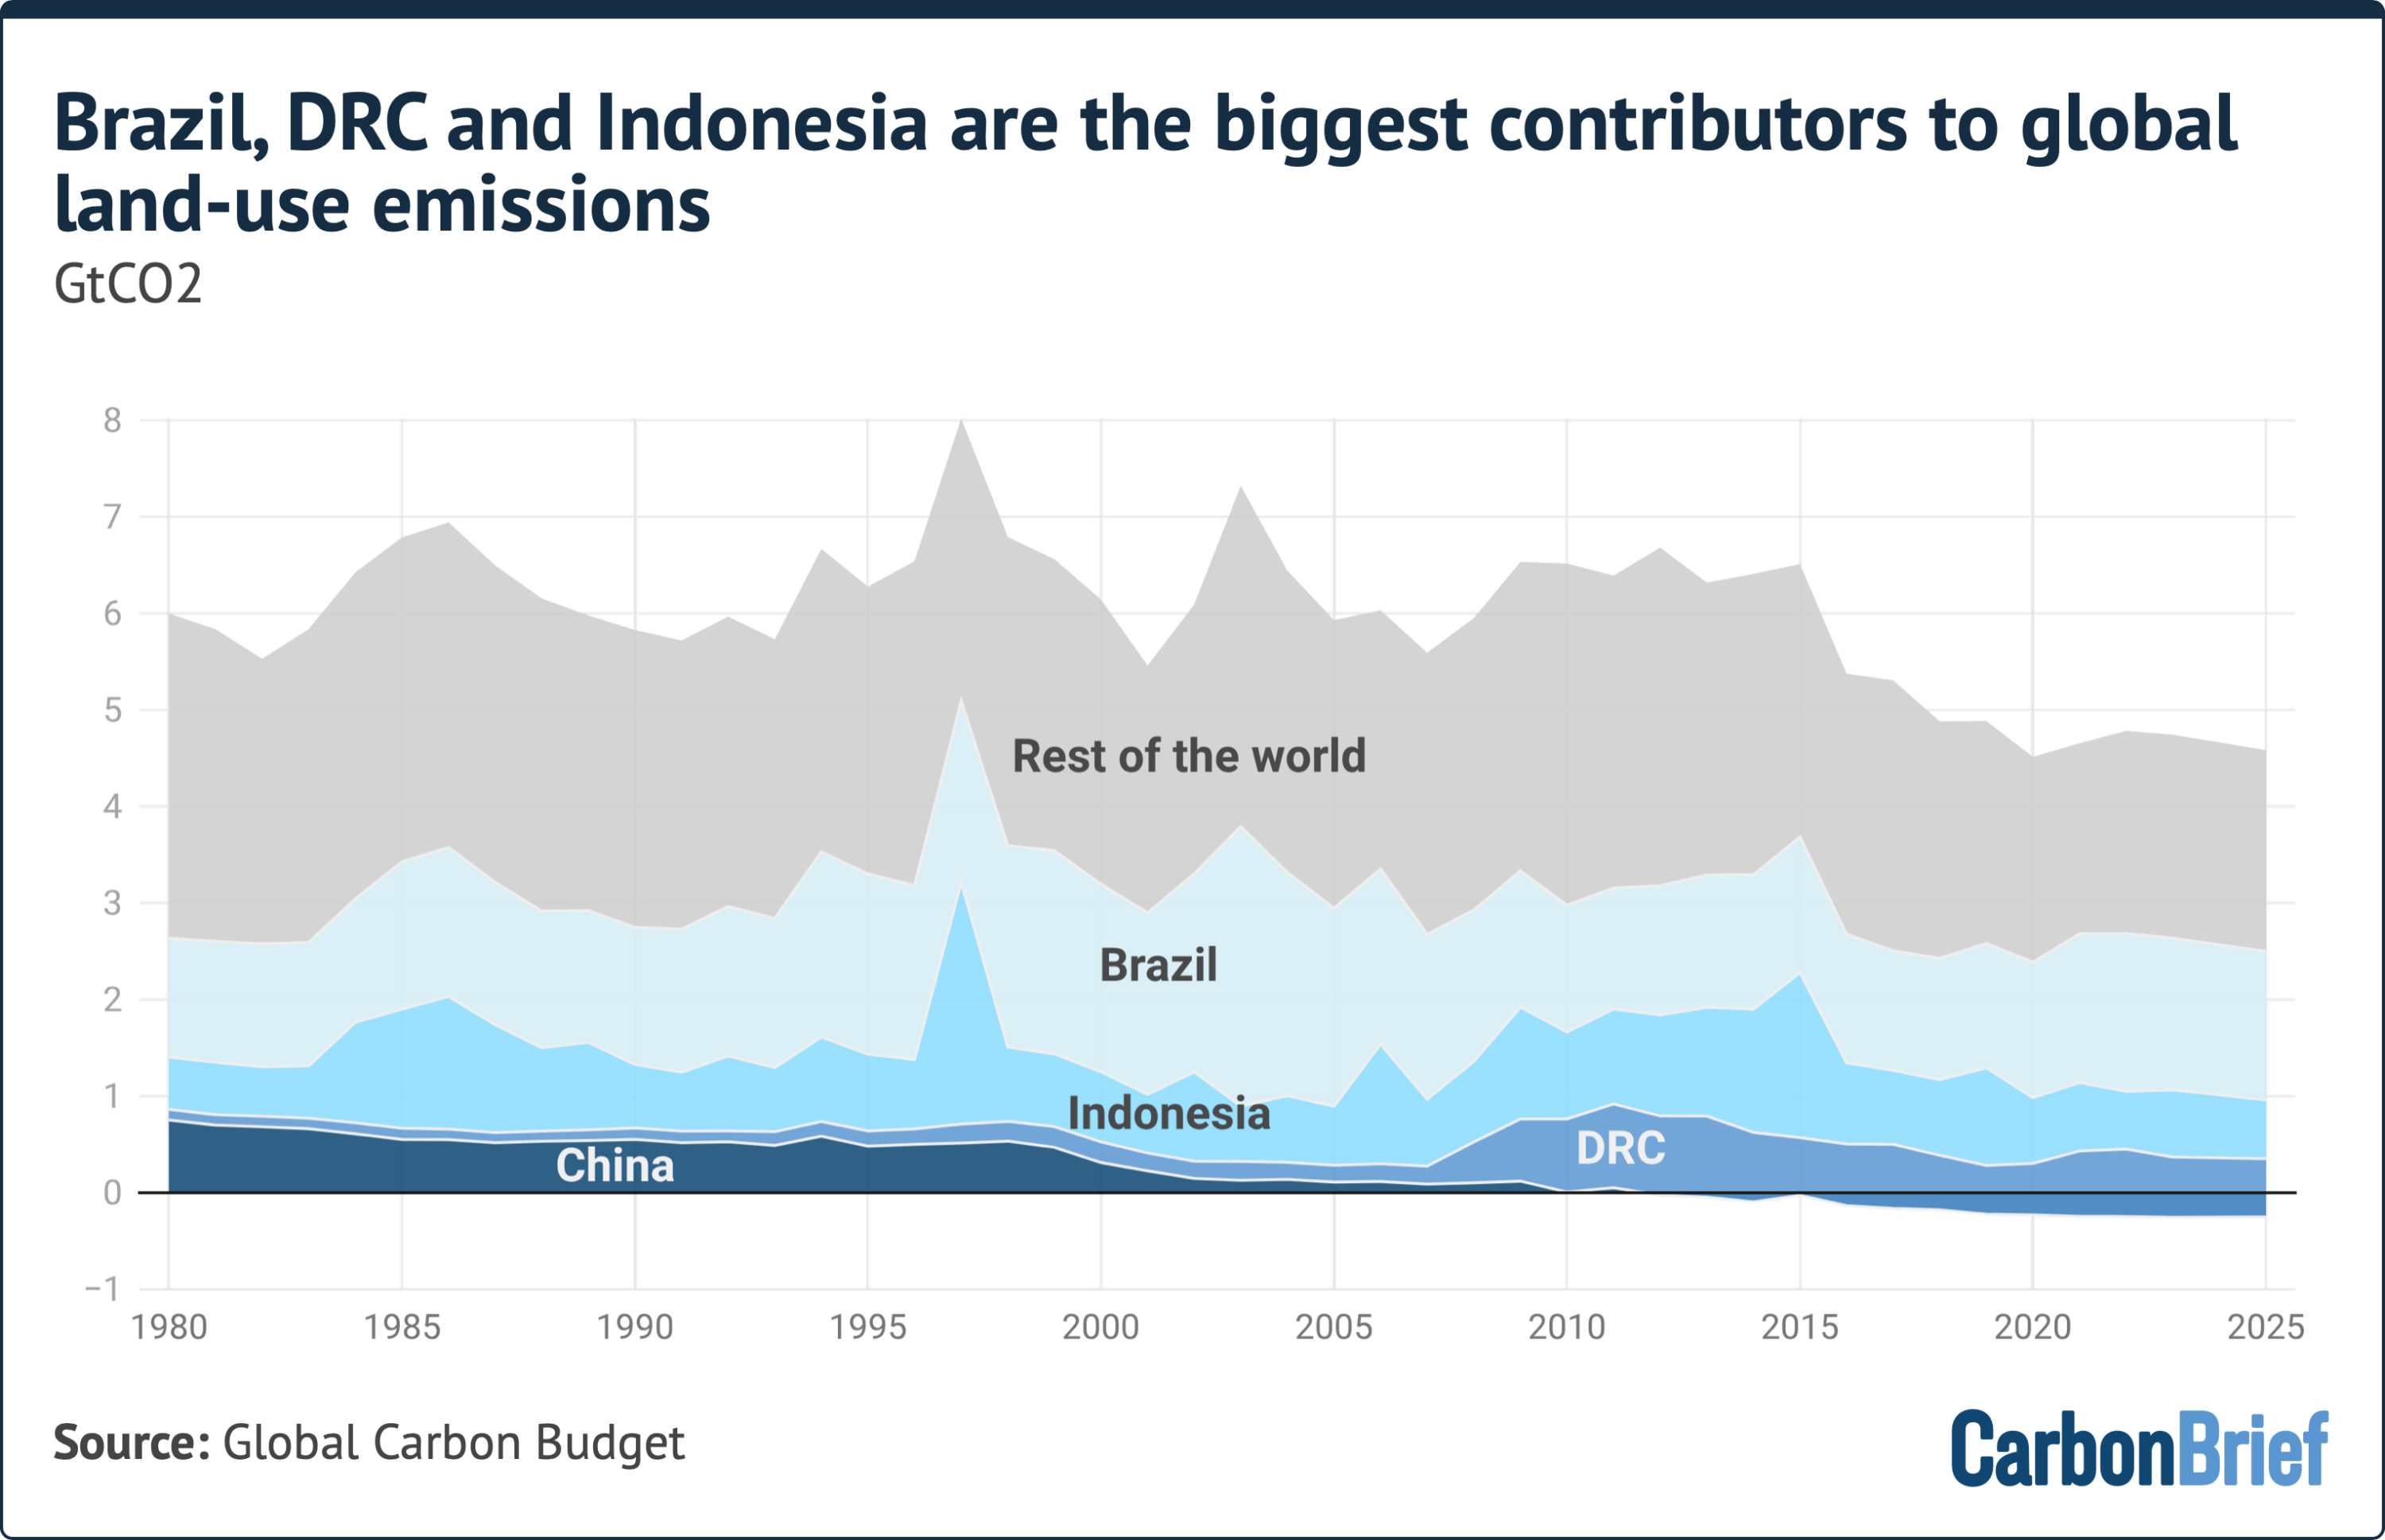
Despite this concentration, reductions in Brazil and Indonesia, paired with massive afforestation efforts in China, have served as the primary engines driving down net global land-use emissions over the past 25 years.
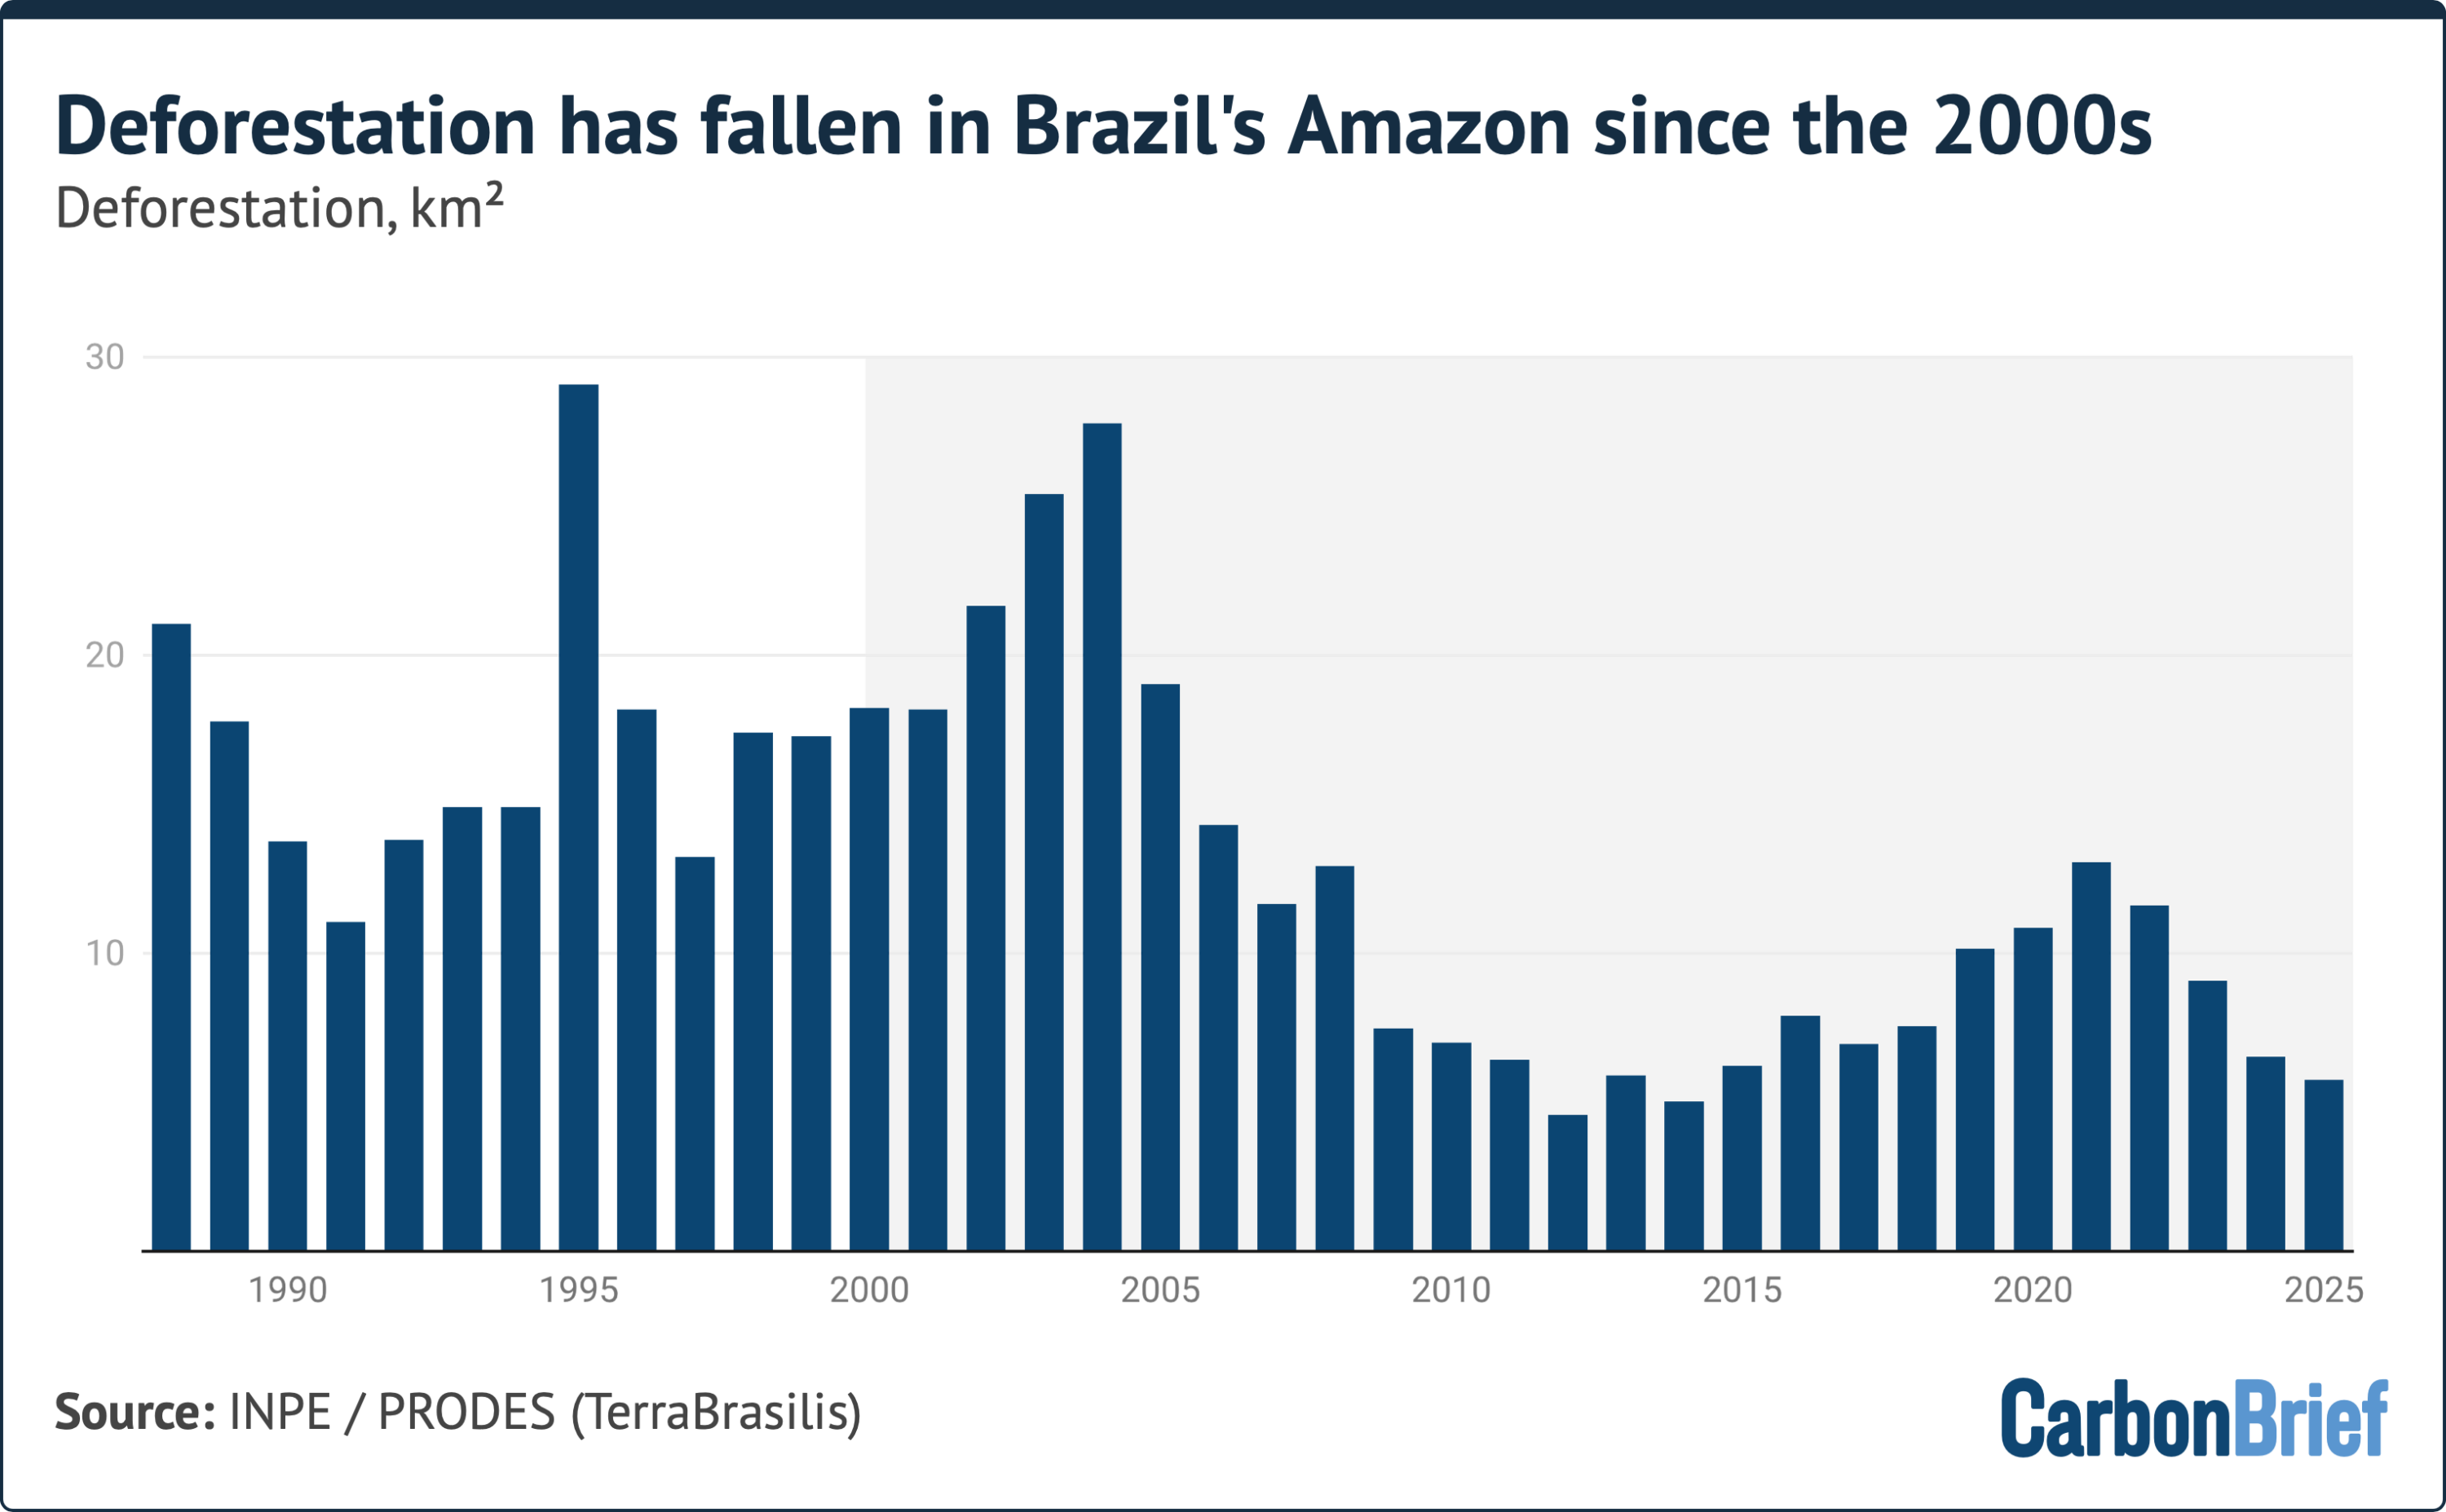
Professor Friedlingstein highlights that the early 2000s peak and subsequent decline were primarily spearheaded by falling deforestation rates in Brazil. Although clearing rates in the South American nation fluctuated over the years depending on shifting political leadership—oscillating under successive administrations—the long-term trend has bent downward thanks to targeted environmental protection policies.
Key interventions in Brazil included a landmark 2004 action plan aimed at preventing and controlling deforestation in the legal Amazon, the implementation of the 2006 soy moratorium which barred financing for soy grown on newly deforested land, and the significant expansion of protected areas throughout the latter half of the decade. Professor Julia Pongratz, a physical geography and land-use systems expert at the University of Munich, notes that Brazil remains the single most influential contributor to the early-century emissions peak and its subsequent retreat.
Meanwhile, the acceleration of the global decline over the past decade has been heavily influenced by Indonesia. Experts point out that Indonesia has successfully rewetted more peatland area since 2017 than Europe has managed across its entire history. Peatlands are routinely drained and exploited for agriculture and horticulture, releasing immense volumes of carbon; rewetting them restores natural waterlogged conditions, halting oxidation and restarting carbon storage. Additionally, Indonesia has experienced fewer catastrophic ecosystem fire spikes over the past ten years.
The situation in the Democratic Republic of the Congo, however, tells a different story. While international trade regulations and supply-chain pressures have helped drive down land-use emissions in export-driven economies like Brazil and Indonesia, they have had a more muted impact in the DRC. Emissions in the DRC have remained persistently high, driven largely by local population growth and the expansion of smallholder subsistence farming rather than massive international commodity exports.
Which Countries Are Leading on Forest Regrowth?
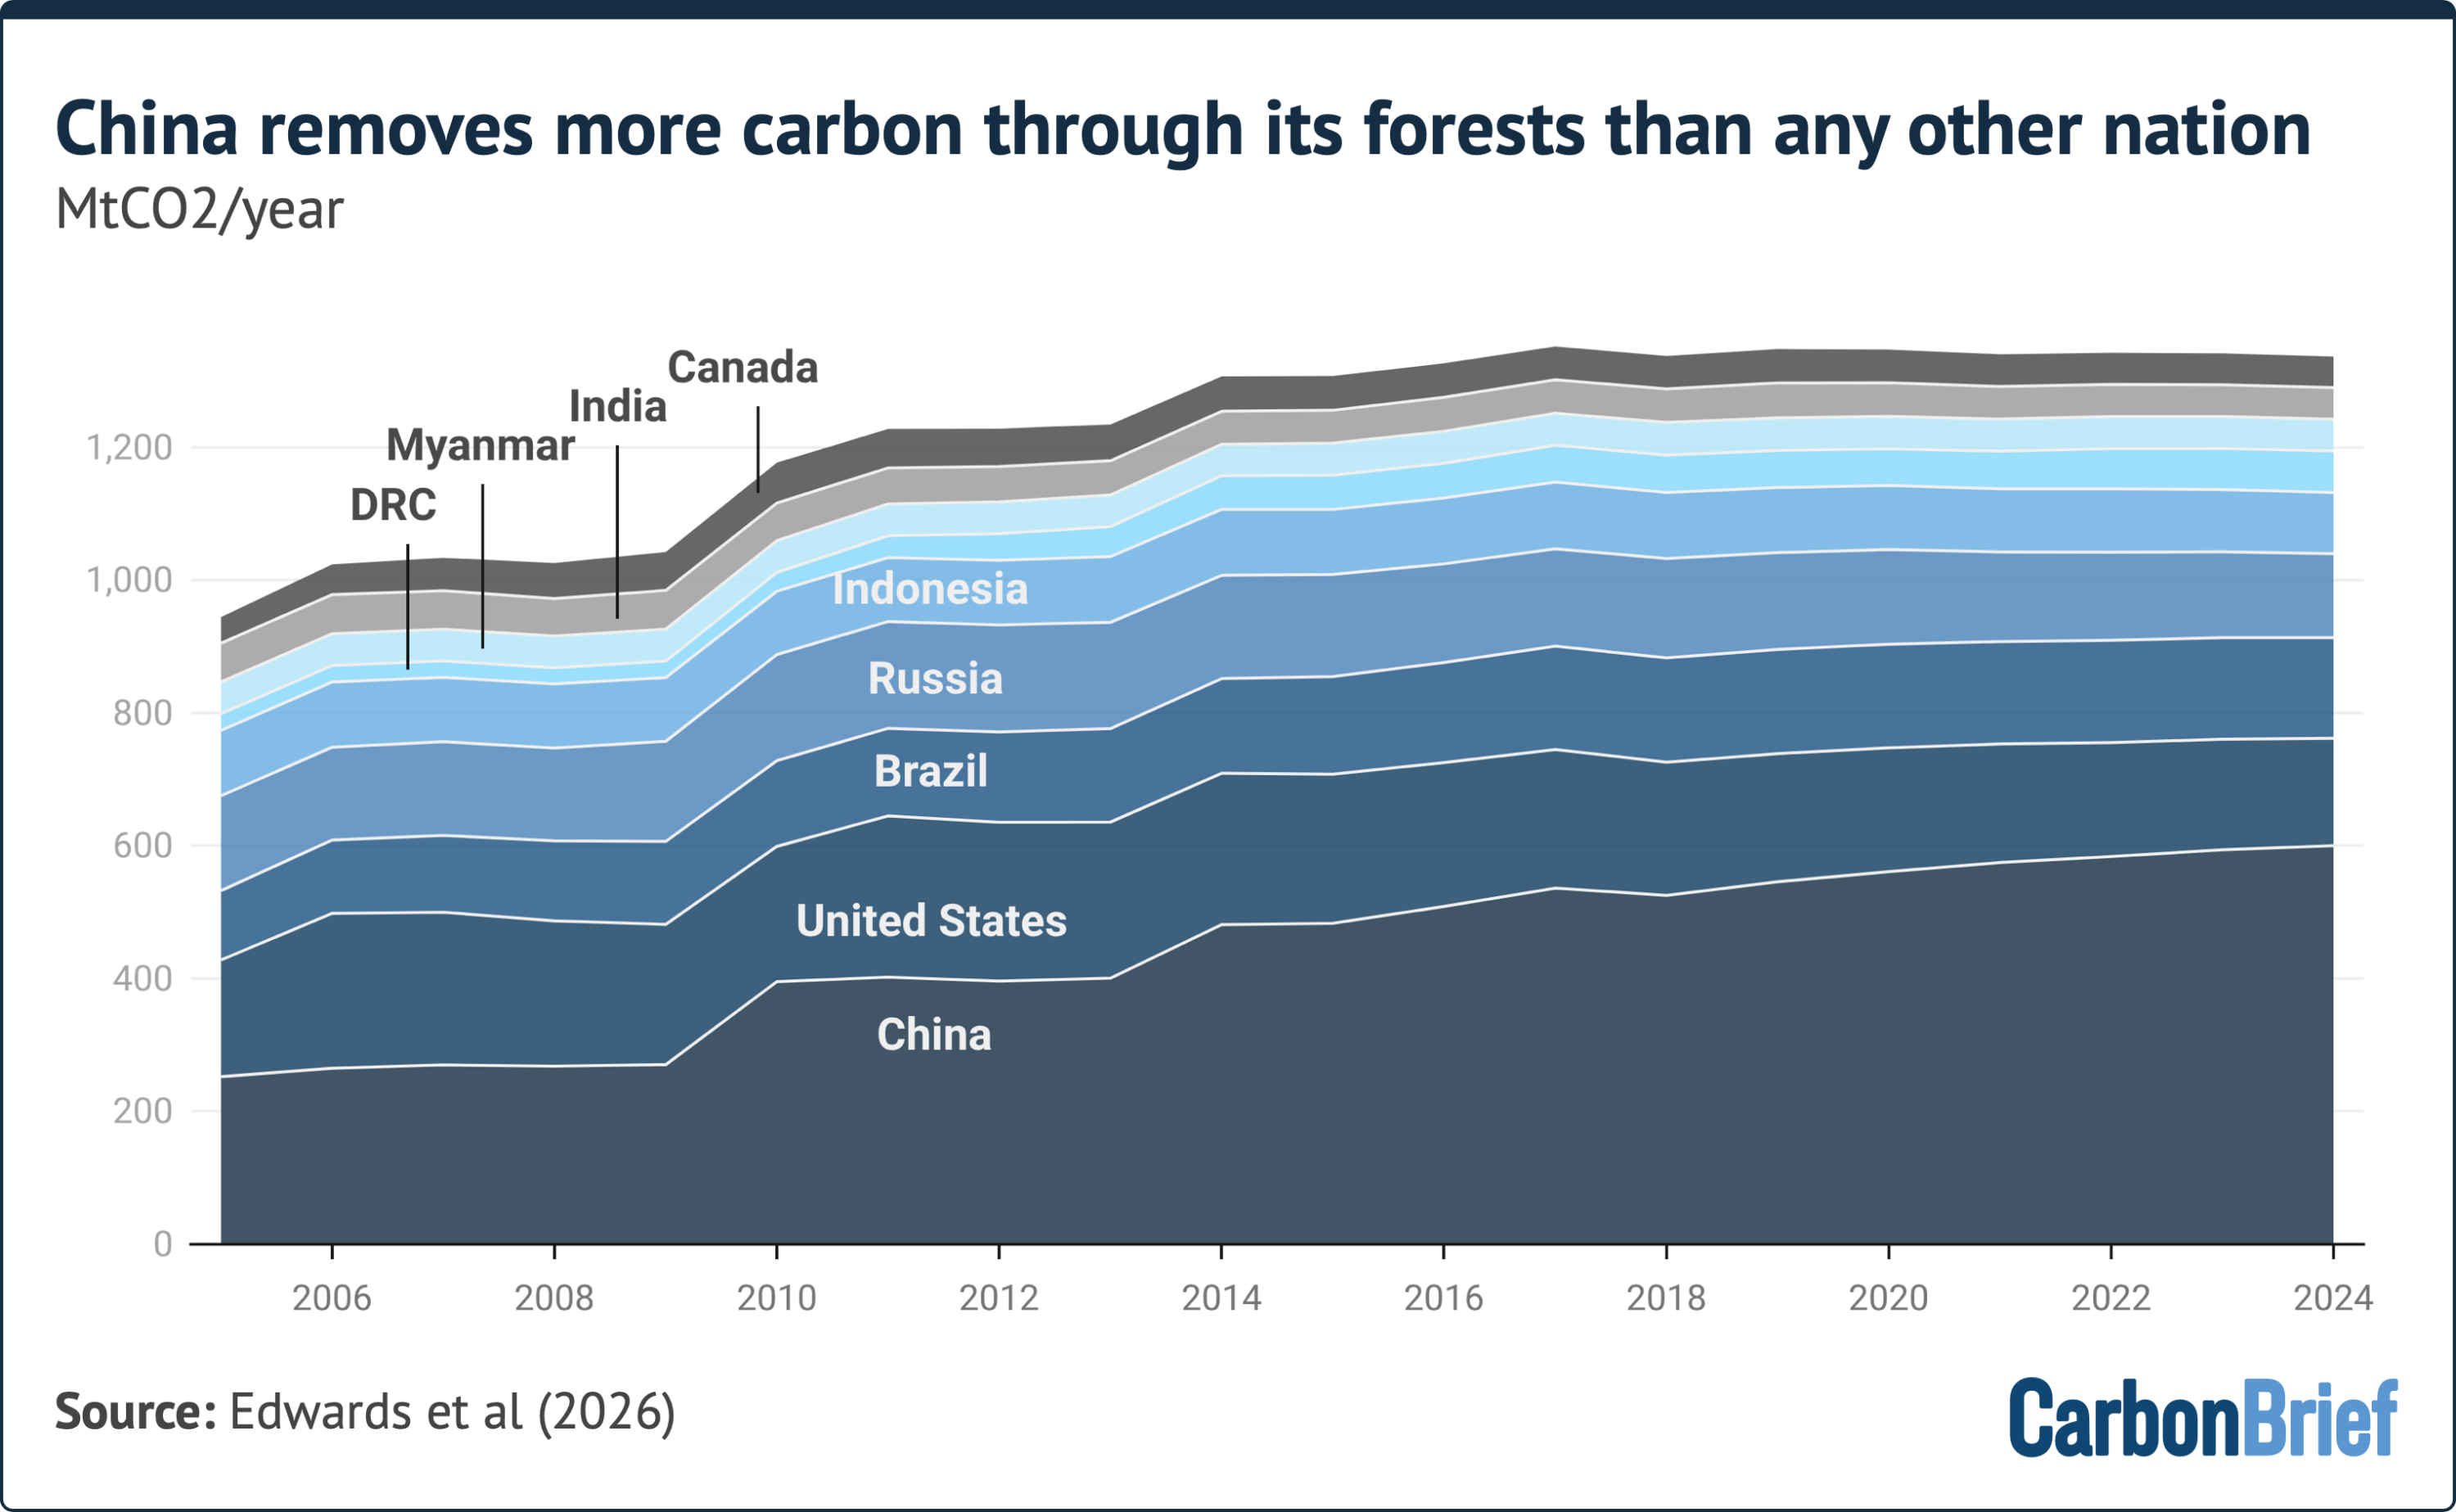
The capacity of recovering forests to pull carbon dioxide from the atmosphere has played an instrumental role in mitigating overall land-use emissions. The 2025 Global Carbon Budget underscores that China, the European Union, and the United States lead the world in carbon sequestration through reforestation and afforestation, collectively pulling down 1.1 billion tonnes of carbon dioxide annually between 2015 and 2024.
China, in particular, has undergone a massive ecological transition. Beginning in the 1990s, the nation introduced sweeping land management and reforestation policies, such as major shelterbelt programs, which successfully rehabilitated tens of millions of hectares of degraded land. These initiatives significantly boosted national carbon uptake, ultimately transforming China’s land sector from a net carbon source into a robust carbon sink.
While countries like Brazil, Russia, and Indonesia also host substantial reforestation projects, their net figures remain dominated by ongoing high-volume emissions from deforestation and other intensive land-use conversions.
Why Are Estimates of Land-Use Emissions Uncertain?
Calculating the global balance of land-use emissions is a complex scientific endeavor fraught with inherent uncertainties. The Global Carbon Budget estimates an uncertainty range of 2.6 billion tonnes of carbon dioxide per year for its average annual land-use figure between 2015 and 2024—a margin that amounts to more than half of the estimated 5-billion-tonne total.
To arrive at these figures, researchers synthesize data from three distinct bookkeeping models: BLUE, OSCAR, and LUCE. These models integrate vast quantities of satellite observations and statistical information regarding land cover changes from global and regional databases.

Scientists explain that while instruments can accurately measure the physical exchange of carbon dioxide between the land surface and the atmosphere, they cannot easily determine whether that carbon is moving due to direct human management or in response to broader environmental and climatic shifts. Isolating human-driven actions requires complex modeling, and because individual models utilize different input datasets and conceptual approaches, discrepancies naturally arise.
For example, while the models exhibit strong agreement regarding emissions tied to permanent deforestation, they treat complex cycles like shifting cultivation and wood harvesting differently. Furthermore, the timing of carbon fluxes varies dramatically: while the emissions pulse from a cleared forest is instantaneous, the corresponding carbon removal via forest regrowth and soil recovery is a painstakingly slow process.
Because comprehensive, direct land-use statistics take years to process across all models—with 2023 serving as the final year calculated directly from complete survey data—scientists must rely on short-term proxies such as deforestation alerts, degradation metrics, and peat fire data for the most recent years. Consequently, confidence in near-term projections remains low, serving as a reminder of the continuous challenges researchers face in tracking the planet’s shifting carbon cycle.