In the fast-paced environment of corporate leadership, bringing an expected staffing shortfall to the attention of decision-makers is a critical responsibility. However, a high-level forecast alone rarely tells executives where the gap is originating or what the underlying drivers might be. When organizational analysts are faced with multifaceted challenges that demand deeper explanation, they frequently fall into a common communication trap: attempting to squeeze every minute detail into a single, overloaded chart.
This exact dilemma recently surfaced during a custom data storytelling workshop hosted for a corporate client. The analytical team was tasked with communicating a complex workforce narrative to executive leadership. Specifically, they needed to demonstrate three interconnected realities: that full-time equivalent (FTE) staffing levels were expected to fall significantly below the established operational plan, that a notable decline in operations support roles constituted a primary driver of this shift, and that leadership needed to actively discuss and formulate a strategic approach to resolve the looming workforce gap.
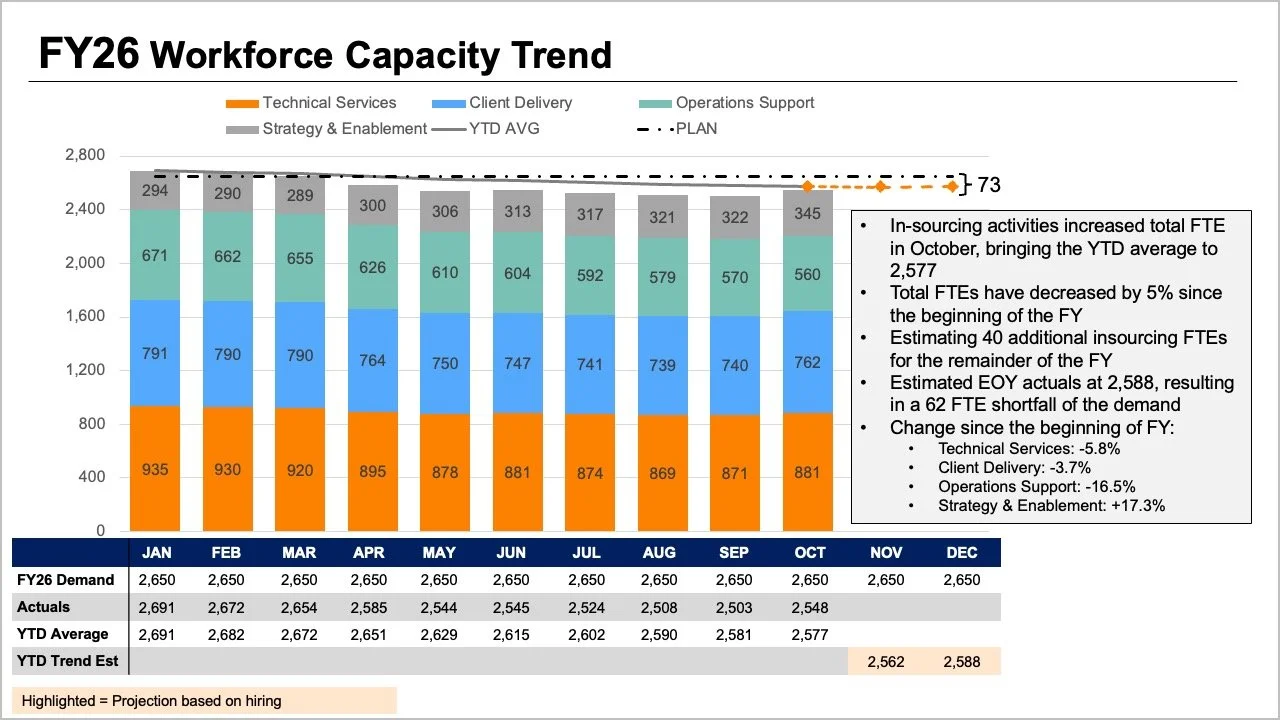
While all the critical information was technically present in their initial presentation materials, the core message was completely buried beneath layers of visual complexity. The original slide demanded that readers process multiple visual cues simultaneously. The tops of stacked bars, separate trend lines, and an accompanying data table all attempted to convey overall FTE metrics in slightly different ways. Meanwhile, the internal segments of the bars illustrated a granular breakdown by job role, while additional variables representing the original plan, actual figures, year-to-date averages, and future projections added yet another layer of cognitive load.

Every single element on that initial slide answered a reasonable and valid question. Yet, when crammed together into a single graphic, they made it exceptionally difficult for an audience to answer any one question well. Recognizing this friction requires taking a step back to evaluate what leadership actually needs to drive a productive conversation. In scenarios like this, executives typically require clear, immediate answers to two fundamental questions: How big of a shortfall should the organization realistically expect, and what do the latest staffing figures reveal about where the workforce changes have specifically occurred?
Rather than continuing to pack every available data point into a single, convoluted graph, the team realized they needed to decouple the information. By splitting the analysis in two, they could dedicate one clean, focused visual to each core question, transforming a confusing slide into an actionable executive briefing.
Using a Line Chart to Clarify the Overall Trend
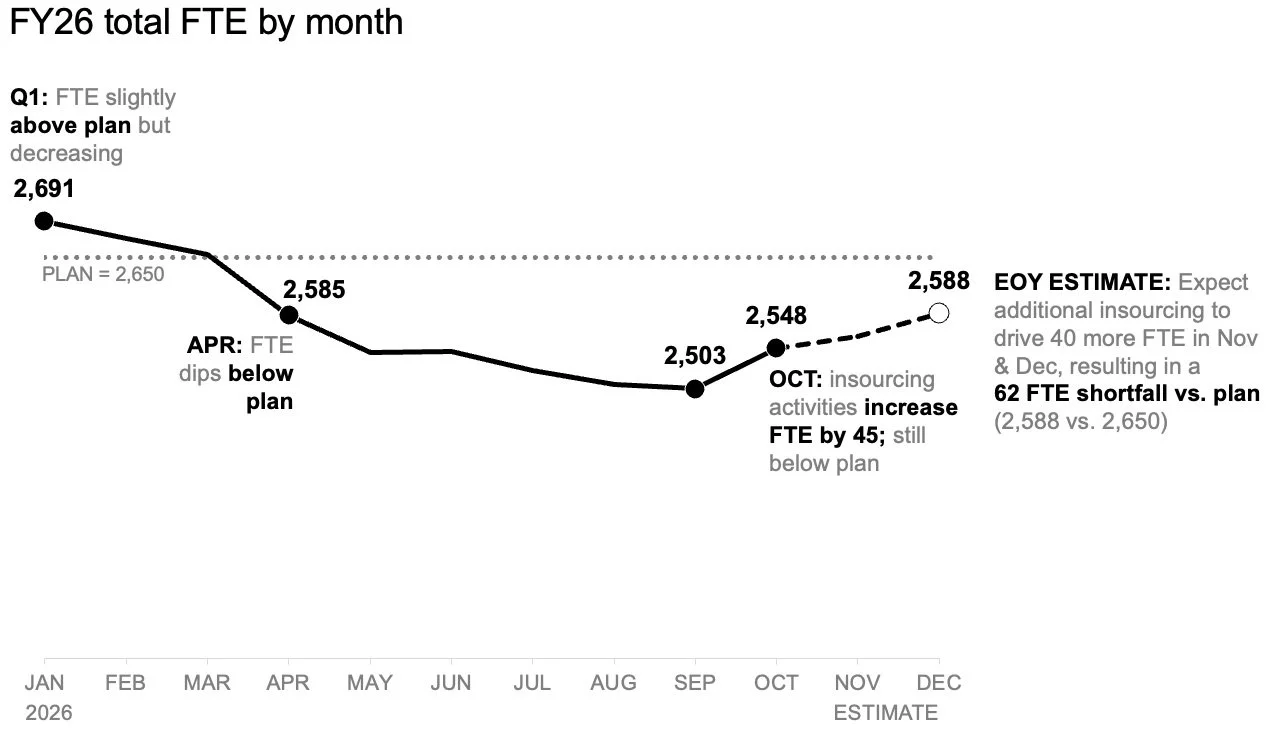
Addressing the anticipated workforce shortfall requires prioritizing simplicity and clarity above all else. The first step in redesigning the communication strategy involved isolating the overall trajectory of the workforce by moving to a standalone line chart.
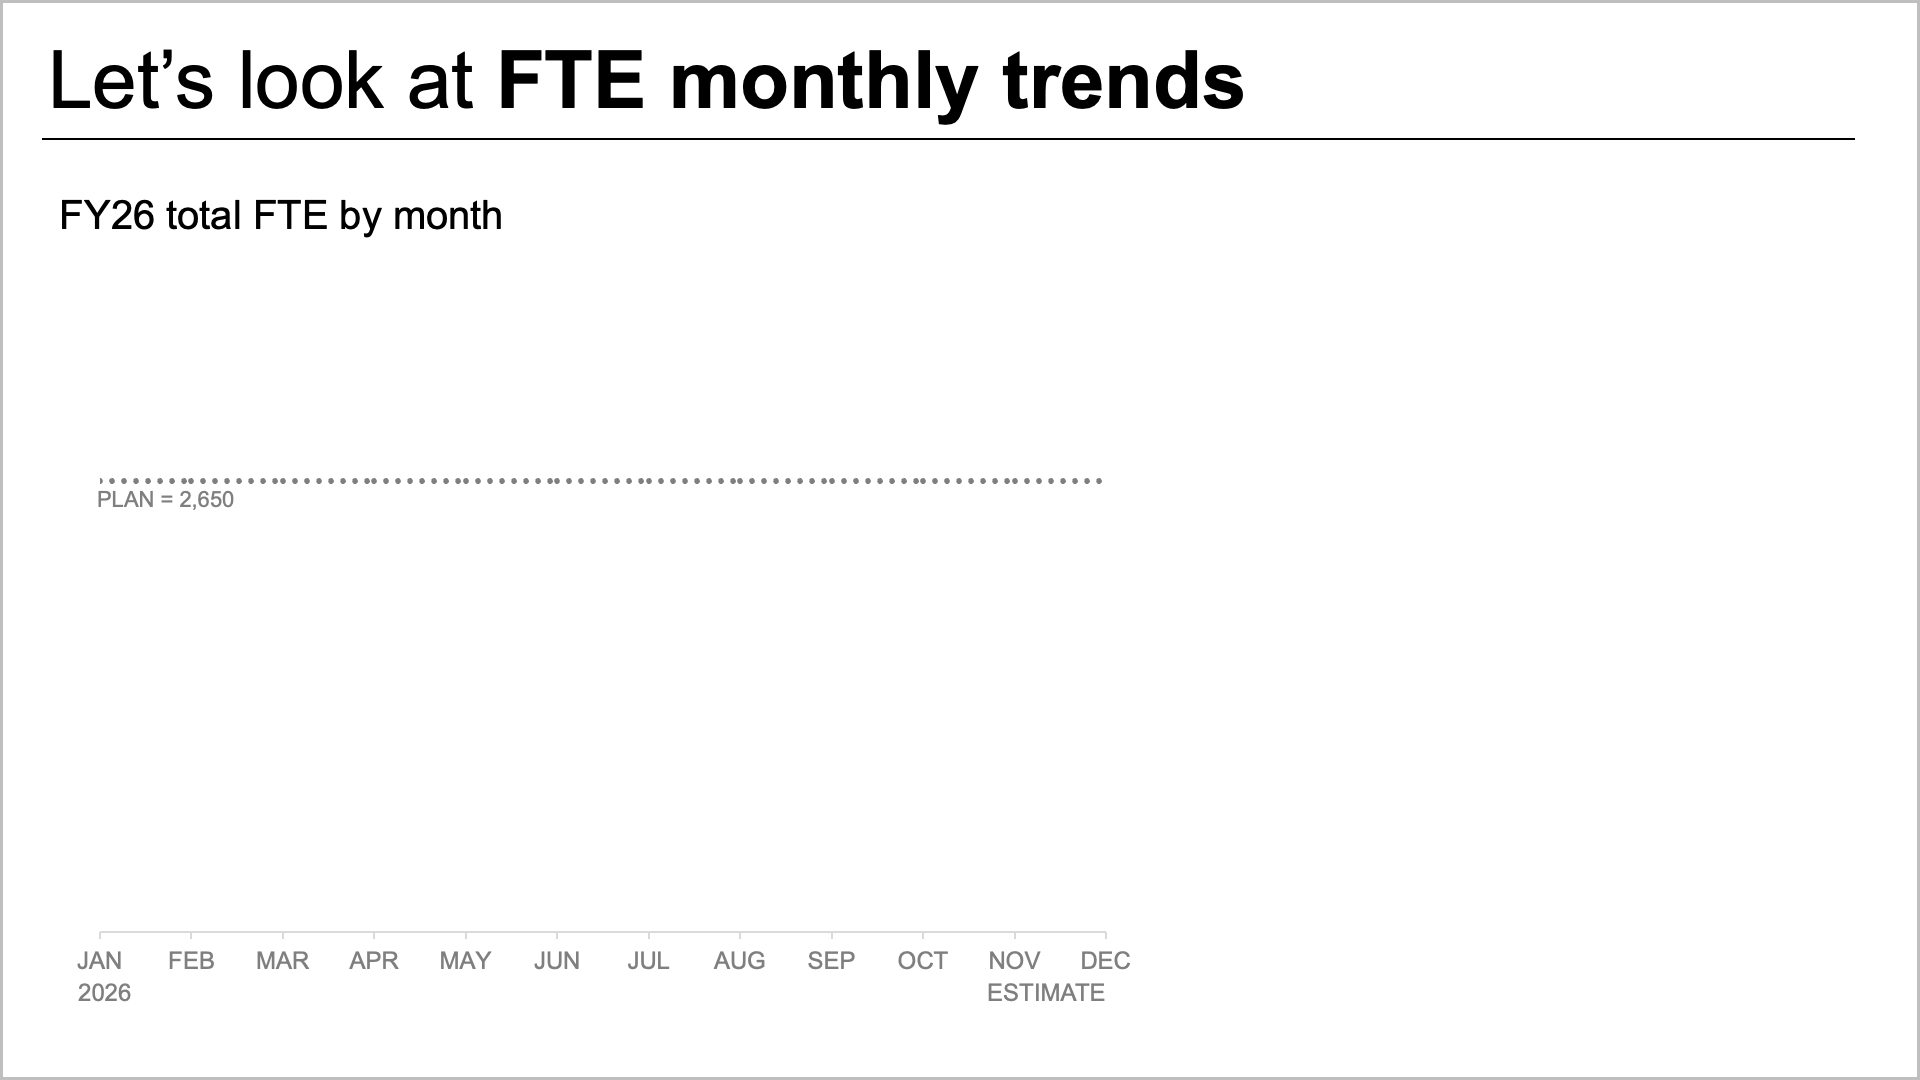
This dedicated view makes it immediately transparent how staffing has historically tracked against the strategic plan established at the beginning of the year, while clearly illustrating how current projections compare going forward. By removing extraneous role-level breakdowns from this primary view, analysts create valuable visual space to incorporate precise annotations at the most crucial inflection points.
Consequently, readers can focus entirely on the expected gap to plan without needing to first decode a complicated mix of job roles or scan back and forth through a dense data table. The line chart establishes a shared baseline understanding across the leadership team, directly answering the macro-level question regarding the sheer scale of the upcoming staffing deficit.
Incorporating a Second View for Role-Level Breakdowns
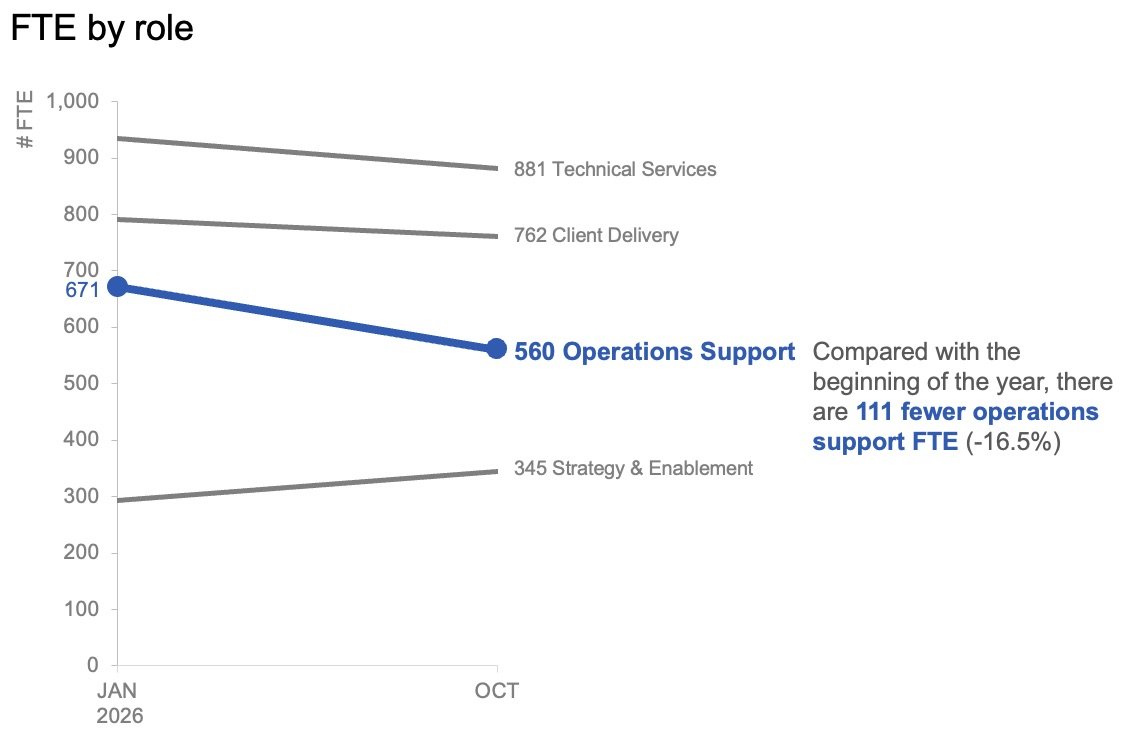
Once the macro-level trend has established the expected variance from annual targets, the analytical focus must naturally shift toward understanding the micro-level drivers. To comprehend where the largest organizational shifts have actually occurred, leadership needs visibility into role-specific changes reflected in the actual data.
In this context, granular month-to-month variations matter far less than the overarching trajectory of specific departments over a broader timeframe. By plotting only the start of the year alongside the latest actual month using a slopegraph, analysts can provide decision-makers with an immediate, intuitive sense of which job roles have experienced the most substantial shifts.
The strategic application of restrained color and minimal descriptive text plays a vital role here. By highlighting only the significant decline in operations support roles, the presentation guides the audience’s attention directly to the most critical anomaly without causing visual fatigue. Together, the macro line chart and the role-level slopegraph function as a cohesive pair. The line chart answers what is happening across the broader organization, while the slopegraph clarifies which specific segments have changed the most so far.
Planning for Diverse Delivery Formats and Audience Engagement
The way data is visualized often depends heavily on the medium through which it is consumed. For reports, executive summaries, or asynchronous documents that might be read or forwarded without a live presenter present to guide the narrative, the two distinct views can sit comfortably together on a single page or slide.
In a static format, a carefully crafted takeaway title can immediately state the magnitude of the expected shortfall. Meanwhile, concise supporting text can point directly to the reduction in operations support roles and signal the urgent need for leadership to discuss strategic next steps. The charts then provide the necessary empirical evidence without competing for visual prominence.
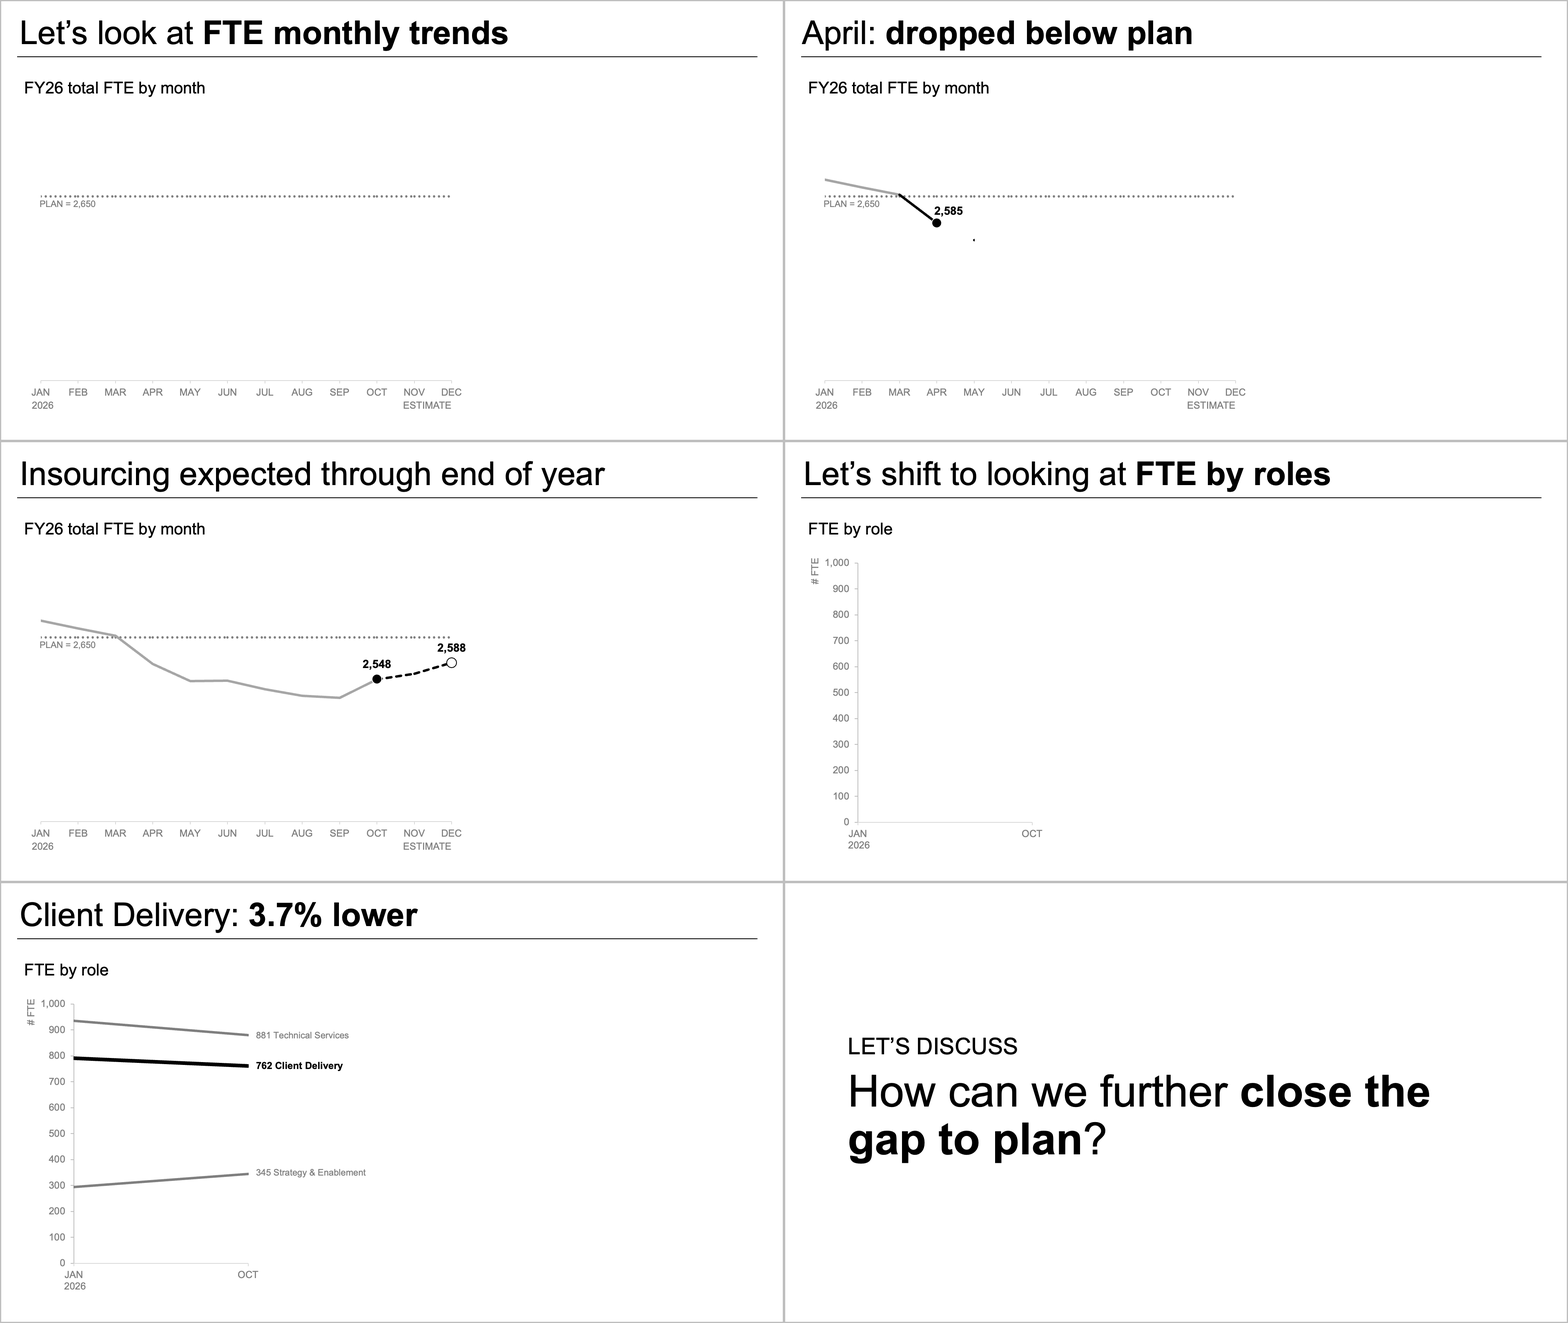
Conversely, a live presentation environment allows for a completely different approach to the same underlying dataset. Rather than asking an audience to absorb an entire summary slide all at once while a speaker talks over the visual noise, presenters can pace the narrative dynamically. A speaker can walk through the overall macro forecast first, allow that insight to land, and then systematically reveal the actual role-level changes piecewise. Finally, the presentation can pivot naturally toward a collaborative discussion regarding remediation strategies.
This sequential unveiling ensures that the audience can comfortably absorb one analytical point before transitioning to the next. While the underlying data and the core message remain entirely unchanged, the adjustment in pacing dramatically reduces cognitive overload and improves audience comprehension.
Separating Complex Insights for Greater Executive Impact
When complex operational challenges require deep analytical support, the temptation to consolidate every piece of information into a single view can be strong. This approach often masquerades as efficiency, driven by the assumption that more data on a single slide equates to a more thorough briefing. However, experience consistently demonstrates that more information does not automatically generate more understanding.
By separating the macro-level FTE trend from the micro-level role shifts, the redesigned communication strategy successfully eliminated ambiguity. Each chart serves a distinct, singular purpose, ensuring that neither visual competes with the other for attention. The resulting format delivers a focused, coherent narrative built on clear evidence—empowering leadership to move past the confusion of raw data and engage directly in meaningful, strategic decision-making.