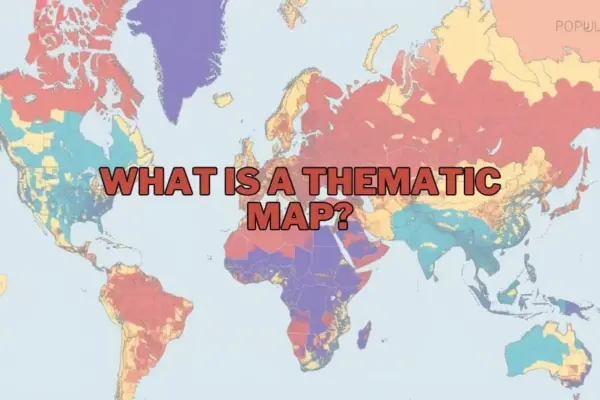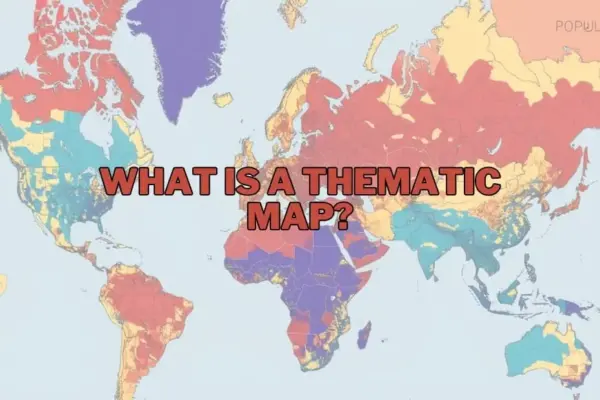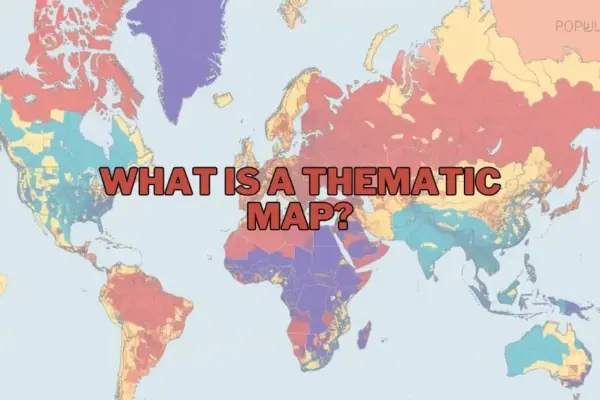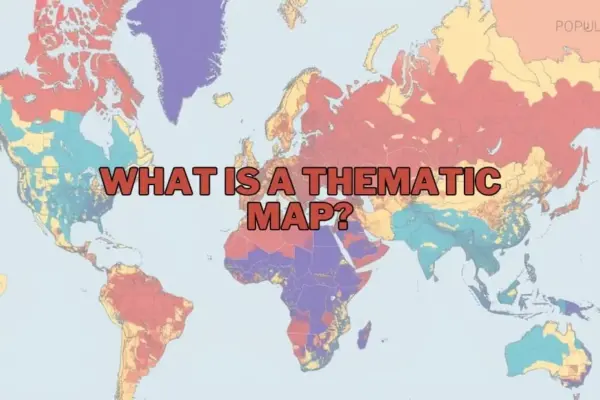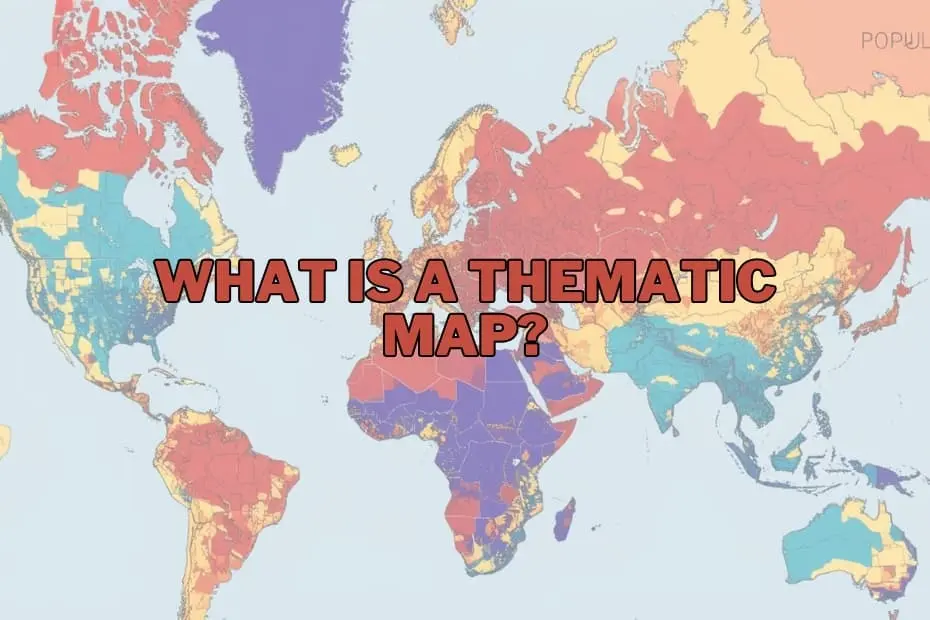
In the contemporary landscape of data visualization and spatial analysis, maps have evolved far beyond basic navigation aids designed to help travellers navigate roads or locate cities. Today, cartography serves as a powerful medium for storytelling, uncovering hidden spatial patterns, and rendering complex datasets accessible to broader audiences. Among the various cartographic methods available to researchers and analysts, thematic maps stand out as an indispensable resource for conveying specialized information in a visual format.
A thematic map is a specialized type of map designed to visually represent data tied to a specific theme, subject, or phenomenon within a defined geographic area. Unlike general reference maps—which prioritize physical and cultural infrastructure such as highways, topographical contours, rivers, and political boundaries—thematic maps prioritize the distribution and variation of a chosen variable. Whether tracking population density, climate shifts, agricultural yield, or localized economic activity, these maps transform raw statistical data into intuitive visual narratives, allowing users to rapidly identify regional trends, concentrations, and spatial anomalies.
Purpose and Importance of Thematic Maps
The primary purpose of a thematic map is to communicate complex spatial information clearly and efficiently. By mapping specific attributes across a geographic surface, thematic maps allow researchers, policymakers, and analysts to discover underlying spatial relationships that would remain obscure within traditional tabular datasets or spreadsheet columns.
The importance of thematic cartography lies in its capacity to simplify dense datasets without stripping away crucial geographic context. For instance, a thematic map displaying regional rainfall variation across a continent provides immediate insights into hydrological patterns, enabling agricultural planners to assess crop viability. Similarly, visualizing localized unemployment rates across municipalities helps government officials target economic interventions where they are needed most.
From analyzing how climate change influences global agricultural productivity to evaluating how rapid urban growth demands updated infrastructure planning, thematic maps serve as a bridge between raw geographic data and informed decision-making. They are routinely applied across academic disciplines, public administration, market intelligence, and environmental management to translate complex metrics into actionable visual intelligence.
Types of Thematic Maps
Cartographers and data analysts employ several distinct types of thematic maps, selecting specific formatting techniques depending on the nature of the data being evaluated and the visual narrative required. The choice of map style relies heavily on whether the underlying dataset is discrete, continuous, categorical, or quantitative.
- Choropleth Maps: Among the most widely used thematic maps, choropleth maps apply varying color shades, tones, or patterns to predefined geographic areas, such as states, counties, or census tracts. The intensity of the color corresponds directly to the statistical value associated with each area, making choropleths ideal for representing aggregated data like population density, per capita income, or literacy rates.
- Isoline (Isarithmic) Maps: Isoline maps utilize continuous lines to connect points on a map that share identical numerical values. This approach is specifically suited for representing continuous surface data that transitions gradually across space, such as precipitation levels, atmospheric pressure (isobars), or temperature distributions (isotherms).
- Dot Density Maps: Dot density maps visually represent the presence or frequency of a phenomenon by scattering uniform dots across a geographic unit. Each dot represents a fixed quantity of the variable being measured—such as a specific number of residents or agricultural livestock—providing a clear representation of spatial concentration and relative sparsity.
- Graduated and Proportional Symbol Maps: These maps utilize symbols—most commonly circles, squares, or icons—placed at specific locations, with the size of each symbol scaled proportionally to the magnitude of the data point. They allow viewers to compare quantitative values across discrete locations without altering underlying political or geographic boundaries.
- Cartograms: Cartograms distort geographic area or distance purposefully based on a specific attribute value. For example, a population cartogram resizes countries so that physical landmass reflects population size rather than actual land area, creating a striking visual contrast between geographic space and statistical weight.
Choosing the correct thematic mapping technique ensures that spatial trends are conveyed accurately without misleading the reader regarding underlying data distributions.
Key Elements of a Thematic Map
Creating an effective and authoritative thematic map requires careful adherence to core cartographic standards. Missing or improperly configured design elements can compromise a map’s readability and lead to misinterpretation.
- Clear A precise title provides necessary context by explicitly stating the map’s theme, geographic scope, and timeframe (for example, "Average Annual Rainfall Distribution in North America, 2010–2020").
- Comprehensive Legend or Key: The legend serves as the decoder for the map’s visual variable system. It must clearly explain what each color shade, symbol size, line type, or pattern represents, including units of measurement and data classification ranges.
- Scale Indicator: A graphic scale, verbal scale, or representative fraction enables users to understand distance relationships and spatial proportions across the mapped area.
- Orientation Indicator: A standard north arrow or compass rose ensures that readers maintain proper spatial direction while interpreting the geographic data.
- Source Data Attribution: Citing data sources builds credibility, allowing users to verify the accuracy, recency, and authority of the spatial information presented.
- Visual Hierarchy and Color Palette: Thoughtful use of color, contrast, and visual weights directs the viewer’s eye toward primary insights while keeping supporting geographic basemaps subtle and legible.
Applications of Thematic Maps
The practical utility of thematic mapping extends across numerous professional fields and scientific disciplines, providing vital support for analysis, planning, and communication.
Public Health and Epidemiology
In public health, thematic maps play a vital role in tracking disease outbreaks, identifying regional healthcare disparities, and mapping environmental risk factors. Visualizing infection rates or access to medical facilities helps health authorities allocate critical resources dynamically.
Environmental Science and Climate Analysis
Environmental researchers rely heavily on thematic mapping to observe ecological change. Maps reflecting atmospheric emissions, temperature fluctuations, deforestation trends, and wildlife habitat changes allow scientists to model climate change impacts and advocate for targeted conservation strategies.
Urban Planning and Infrastructure
City planners and municipal engineers utilize thematic cartography to analyze zoning patterns, traffic volume, housing density, and infrastructure distribution. Visualizing growth patterns allows local authorities to plan public transit systems, water grids, and emergency response zones effectively.
Economics and Business Intelligence
In commercial sectors, thematic maps are fundamental to market research, site selection, and strategic planning. Businesses use spatial visualization to analyze consumer demographics, identify market saturation zones, monitor regional sales performance, and evaluate supply chain efficiency.
Historical Analysis and Demographic Research
Demographers and historians use thematic maps to track spatial shifts over time, such as historical human migrations, changing political boundaries, and long-term population redistribution.
Advantages of Thematic Maps
The widespread adoption of thematic cartography across diverse industries stems from several key benefits:
- Enhanced Data Accessibility: Thematic maps simplify large volumes of tabular numerical data, converting abstract statistics into visual representations that can be comprehended quickly.
- Pattern and Trend Identification: By displaying information spatially, thematic maps reveal clustering, spatial corridors, geographic disparities, and regional trends that are difficult to detect in spreadsheets.
- Outlier Highlight: Anomalies or unexpected statistical deviations stand out immediately when mapped visually, allowing researchers to investigate local irregularities promptly.
- Improved Communication and Engagement: Visual maps offer a compelling format for presenting research findings, policy proposals, and public disclosures to non-expert stakeholders.
Limitations of Thematic Maps
Despite their strength as visual communication tools, thematic maps possess structural limitations that creators and users must navigate responsibly:
- Risk of Misinterpretation: Poorly designed choropleth maps can create false visual impressions. For instance, large geographic areas with low population densities can visually dominate a map, overshadowing small, densely populated urban areas containing much larger absolute statistical values.
- Data Aggregation and Generalization: Aggregating continuous data into fixed spatial boundaries (such as zip codes or administrative regions) can mask localized variations inside those boundaries, a cartographic issue known as spatial generalization.
- Classification Bias: The method chosen to group data into categories (such as equal intervals, natural breaks, or quantiles) can alter the visual appearance of a map significantly, potentially leading to different analytical conclusions from the same underlying dataset.
Tools and Software for Creating Thematic Maps
Advancements in digital technology and spatial data platforms have made thematic map creation widely accessible. A range of geographic information system (GIS) tools and business intelligence platforms are available today:
- QGIS: A powerful, open-source Geographic Information System that provides robust cartographic capabilities, enabling users to manage, analyze, and format complex spatial vector and raster datasets at no cost.
- Tableau: A widely adopted business intelligence platform that integrates spatial mapping functionality, allowing users to build interactive thematic dashboards easily from enterprise data sources.
- ArcGIS: An industry-standard commercial GIS ecosystem offering comprehensive spatial modeling, advanced spatial analytics, and high-end cartographic production tools.
- Web-Based Mapping Platforms: Modern web cartography tools and open libraries allow developers and analysts to generate dynamic, interactive thematic maps directly within web applications.
Frequently Asked Questions About Thematic Maps
What is the difference between a thematic map and a reference map?
A reference map prioritizes the geographic location of physical and political features—such as roads, boundaries, rivers, and cities—to help users navigate or locate places. A thematic map focuses primarily on illustrating the spatial distribution and variation of a specific theme, metric, or dataset, using the underlying geography merely as a positional backdrop.
Can thematic maps be used for historical data analysis?
Yes. Thematic maps are exceptionally effective for historical research, enabling scientists and historians to map longitudinal changes over time, such as demographic shifts, historical agricultural yields, regional conflict boundaries, or long-term urban expansion patterns.
What software is best for beginners learning to create thematic maps?
For beginners entering spatial analysis, platforms like Tableau offer an intuitive, drag-and-drop interface ideal for basic spatial visualization. For users seeking comprehensive, cost-free cartographic control, QGIS serves as the premier open-source GIS application, offering extensive tutorials and community support.
How do I choose the right type of thematic map for my data?
Selecting the appropriate thematic map depends on data structure. Continuous variables that change smoothly across geographic surfaces—such as temperature or rainfall—are best represented using isoline maps. Categorical data or discrete statistical values aggregated by administrative boundaries are best visualized using choropleth maps, while point-specific quantitative values suit graduated symbol or dot density maps.
Are thematic maps restricted exclusively to geography?
No. While grounded in geographic spatial data, thematic maps are extensively utilized across diverse non-geographic domains, including public health, corporate strategy, environmental management, social science, economics, and public policy formulation.