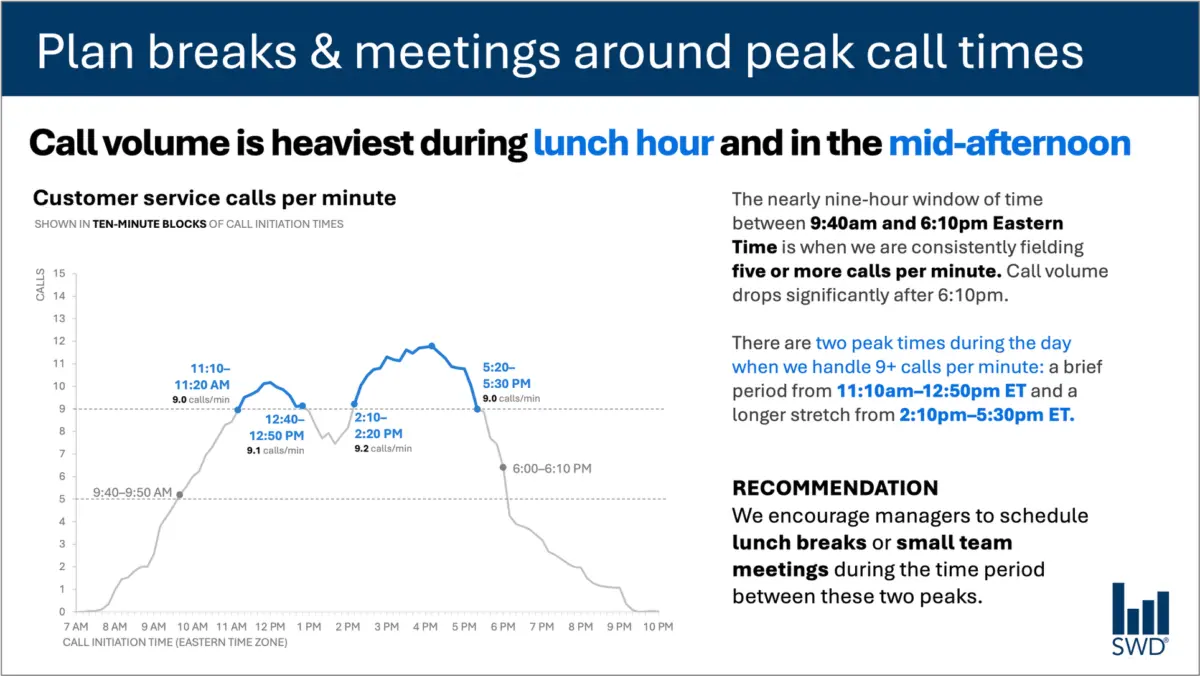
When corporate analysts or communicators present data to decision-makers, the instinct is often to let the numbers speak for themselves. A clean line graph tracking customer service call volume throughout a standard workday, for instance, might show a predictable trajectory: calls climb steadily through the morning hours, remain high for the duration of the workday, and spike sharply around lunch and again in the mid-afternoon.
Presented on its own, this visualization offers a clear statistical pattern. Yet, if the audience viewing the graph consists of staffing managers rather than data enthusiasts, simply displaying the trend line falls short of effective communication. Staffing managers are not looking at call volume out of idle curiosity; they are looking at information to make operational decisions. When data presentation adapts to this practical context, the entire approach to utilizing text on a slide or report shifts fundamentally.
This intersection between raw data, human audience, and purposeful language forms the core of modern data communication challenges. Rather than treating text as a mere accessory or striving for a misguided minimalism that strips away all surrounding context, professional communicators are increasingly recognizing that every word on a slide must serve a distinct, deliberate function.
The Anatomy of an Effective Data Display
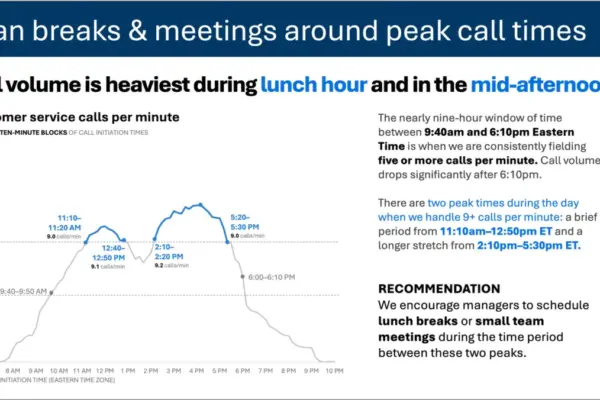
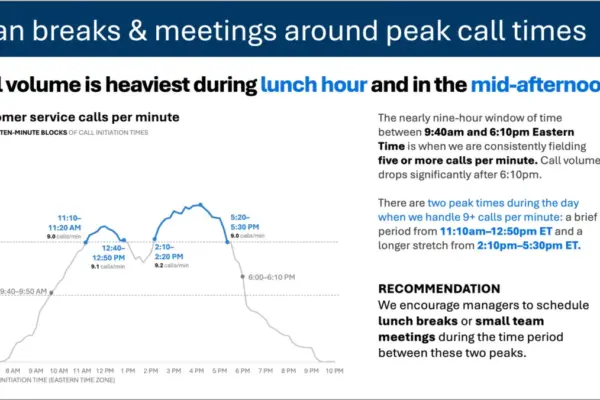
Consider how the framing of a customer service call volume chart changes when designed with the end user in mind. Instead of relying on a generic visual, an effective layout employs targeted text elements to guide the viewer toward action. A strong takeaway title—such as a directive to plan breaks and meetings around peak call times—immediately informs staffing managers what matters most in the data. Meanwhile, a descriptive graph title, such as customer service calls per minute, grounds the audience in the underlying metrics.
Annotations added to the visual identify precisely when call volume crosses important operational thresholds, supplying necessary context about the nature and timing of the two daily peaks. Finally, a clear recommendation translates the visual evidence into a specific execution strategy, such as scheduling lunch breaks or small team meetings exclusively during the lulls between the peaks.
Each piece of text in this framework performs a specific job. This operational reality challenges a common misconception in presentation design: the notion that reducing word count is inherently better. While removing all surrounding text creates a more minimalist aesthetic, it frequently compromises utility. Stripping away explanatory context leaves the audience guessing about what actions to take. Achieving clarity requires adding the right words to ensure effective communication, rather than blindly cutting text in the pursuit of white space.
Different Words Do Different Jobs
Deciding which words belong on a graph or presentation slide requires a clear understanding of what the audience needs to extract from the visual material. Different text components fulfill distinct communication roles within a single display.
A takeaway title communicates the core takeaway message or recommended action, cutting straight to the operational implications. A descriptive graph title establishes the baseline context, orienting the audience to the physical parameters of what they are observing. Direct labels integrated into the visual eliminate the cognitive friction of referring back and forth to an external legend. Annotations explain underlying causes, draw attention to critical anomalies, or add qualitative context that remains entirely invisible from the raw numbers alone. Meanwhile, conventional elements like axis titles, footnotes, and source citations provide foundational detail whenever deeper scrutiny is required.
Crucially, not every graph or data visualization demands the inclusion of every single text element. The ultimate objective is deliberate design. Communicators must ask critical questions about what their audience needs to comprehend the material, what conclusions or actions should result from the presentation, and where a few well-chosen words can eliminate confusion or make a central point unmistakable. Once those priorities are established, any surrounding text that fails to actively advance the audience’s understanding can be safely discarded.
The Human Element in the Age of Automated Insights
This nuanced approach to context and audience utility highlights why human oversight remains indispensable, particularly as organizations increasingly partner with artificial intelligence to generate reports and visual aids.
If an organization feeds raw call-volume data into an advanced artificial intelligence model and asks it to generate a presentation slide, the technology can readily identify the underlying statistical pattern. The system might accurately determine that call volume peaks around lunchtime and again in the mid-afternoon, subsequently generating a polished sentence describing that observation.
However, a descriptive sentence is not yet an actionable insight. A truly useful recommendation emerges only when raw data is combined with external, human-held context: Who is the specific audience? Why are they reviewing this information? What operational constraints do they care about? What decisions remain entirely within their control? Once it is established that the audience comprises staffing managers facing specific scheduling constraints, a statistical pattern transforms into actionable intelligence.
This principle underpins modern frameworks for data literacy and artificial intelligence integration, emphasizing that users must provide AI with comprehensive contextual framing before asking for communication assistance. While artificial intelligence tools excel at finding concise wording, suggesting alternative titles, refining labels, and testing different ways to articulate an idea, a human professional must still understand the operational environment well enough to recognize what truly matters.
A polished sentence generated by an algorithm is fundamentally distinct from deep organizational insight. Professionals who spend extensive time working directly with operational data possess institutional knowledge that algorithms lack. They understand the historical background, recognize what operational changes occurred recently, and grasp the broader organizational dynamics that influence their audience. They can easily distinguish between a statistical movement that carries profound business consequences and another that appears equally prominent on a chart but remains operationally irrelevant.
Integrating that specialized knowledge into data presentations requires making analytical thinking visible through carefully chosen language. The ultimate goal in modern data storytelling is never about maximizing or minimizing word counts; rather, it is about deploying the right words to ensure every element on the page or screen performs its necessary job.