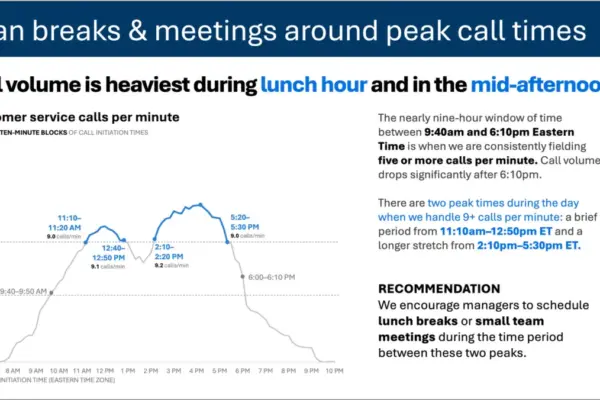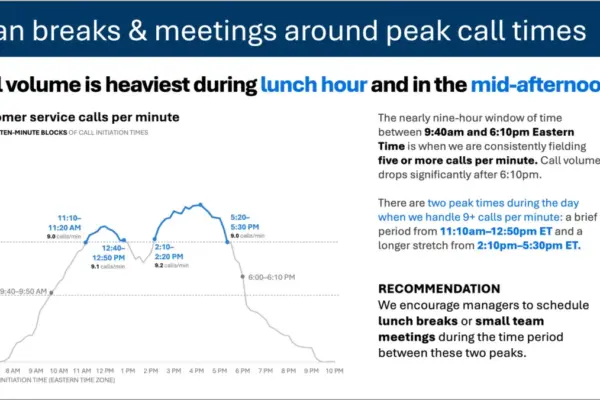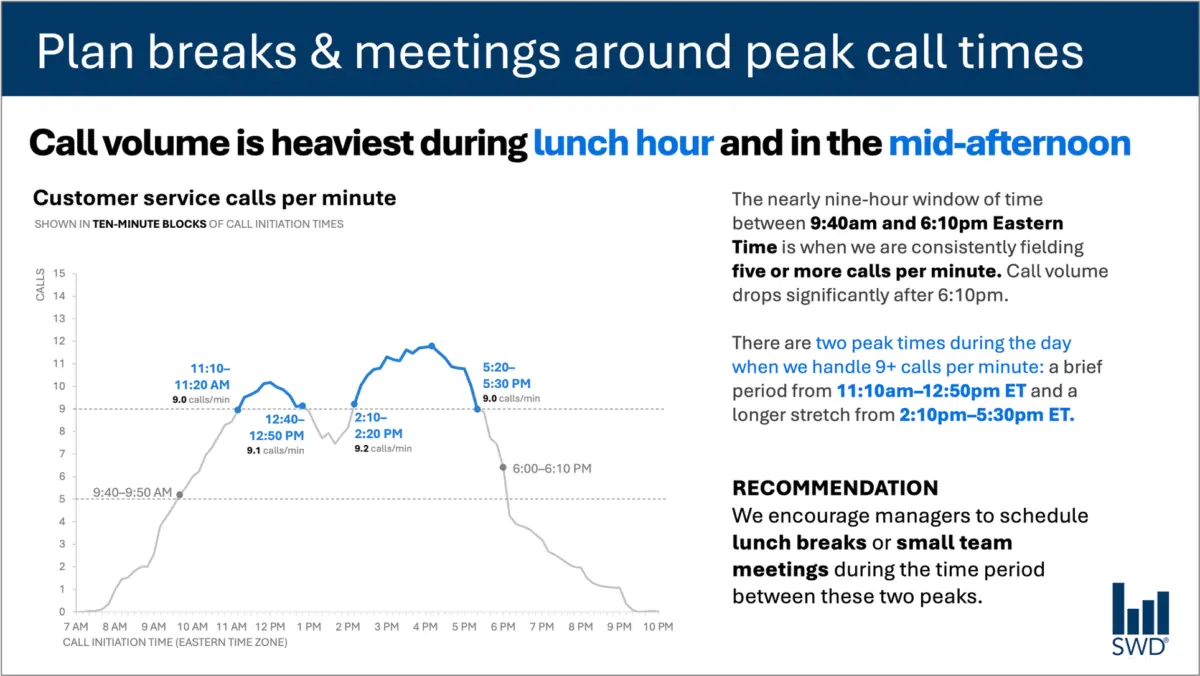
The graph itself is straightforward: customer service call volumes follow a predictable daily rhythm. Calls climb steadily through the morning, remain high across the bulk of the standard workday, and spike during two distinct windows—around lunchtime and once again in the mid-afternoon.
Viewed in a vacuum, the chart simply displays a pattern over time. But the audience examining this visualization is not looking at it out of idle curiosity. They are staffing managers. The information is being presented to them because they have the operational power to act on it.
That single realization fundamentally changes the nature of the communication, shifting the focus from passive observation to active utility.
When designing a presentation or report for operational leaders, every piece of surrounding text must earn its place. A takeaway title such as "Plan breaks & meetings around peak call times" immediately signals to staffing managers what matters most. Meanwhile, a precise descriptive graph title—such as "Customer service calls per minute"—orients them to the baseline data they are evaluating. Strategic annotations identify precisely when call volume crosses critical operational thresholds and provide crucial context regarding the two daily surges. Finally, the core recommendation translates the visual evidence into a clear, tangible instruction: schedule lunch breaks or small team meetings between the peaks rather than during them.
Each bit of text serves a distinct operational job. This dynamic highlights a common misconception in professional communication: the belief that reducing word count is inherently better. Stripping away all surrounding text to make a slide minimalist might create a cleaner aesthetic, but it rarely makes the asset more useful. True effective communication relies not on arbitrary brevity, but on deploying the right words to guide understanding and drive action.
Different Words Do Different Jobs
Deciding which words belong on a graph, slide, or report requires a deliberate assessment of what the audience needs to successfully interpret and utilize the information. Different textual elements fulfill entirely separate functions within the same visual framework.
A takeaway title communicates the core message or required action, cutting straight to the underlying significance of the data. A descriptive graph title grounds the audience, ensuring they understand the parameters of what they are viewing without second-guessing the metrics. Direct labels eliminate the cognitive friction of referring back and forth between a visual element and a distant legend. Annotations explain historical anomalies, draw attention to critical inflection points, and add qualitative context that cannot be gleaned from raw numbers alone. Meanwhile, axis titles, footnotes, and source citations provide foundational detail for stakeholders who need to audit the underlying metrics.
Not every graph or presentation slide requires every single one of these components. The overarching goal is deliberate design. Communicators must ask what their audience needs to truly comprehend the data, what those stakeholders should know or do as a result of seeing it, and where a few well-chosen words can eliminate confusion or make an underlying point unmistakable. Once those needs are met, extraneous words that fail to add value can be discarded.
The Insight Has to Come from Somewhere
This operational reality underscores why human expertise remains irreplaceable, even as organizations increasingly incorporate artificial intelligence into their data analysis and storytelling workflows.
Consider a hypothetical scenario where raw call-volume data is handed to an artificial intelligence tool with a prompt to generate a presentation slide. The AI would likely succeed in identifying the underlying pattern. It could readily determine that call volume peaks around lunchtime and during the mid-afternoon, and it could effortlessly synthesize that observation into a polished, grammatically correct sentence.
Yet, describing an observation is not the same as generating an insight.
Valuable recommendations emerge only when raw data is synthesized with broader organizational context. Questions such as who the audience is, why they are reviewing the data, what they care about most, and which decisions fall within their direct control are vital. Once it is established that the audience consists of staffing managers, a standard statistical pattern transforms into an actionable operational strategy.
This principle forms a core component of modern data communication frameworks, including specialized guidance such as the SWD + AI Primer. The fundamental rule is to provide AI systems with the necessary context before asking them to assist with communication. Artificial intelligence can serve as a powerful assistant for finding concise phrasing, suggesting alternative titles, drafting labels and annotations, and testing different ways to articulate a concept. However, human operators must still understand the underlying business situation well enough to recognize what truly matters.
A polished sentence generated by an algorithm is never a substitute for genuine human insight. Professionals who have spent time working directly with the data possess institutional knowledge that an AI model cannot inherently replicate. They know the operational history, understand what changed in the environment, and grasp the broader organizational stakes. They can distinguish between a statistical movement that is genuinely consequential and one that appears prominent on a chart but holds no real operational significance.
Bringing that specialized knowledge to a presentation or report allows professionals to make their analytical thinking visible to decision-makers. The ultimate objective is never about maximizing or minimizing word counts; it is about finding the right words to do the right jobs, ensuring that data ultimately translates into meaningful action.