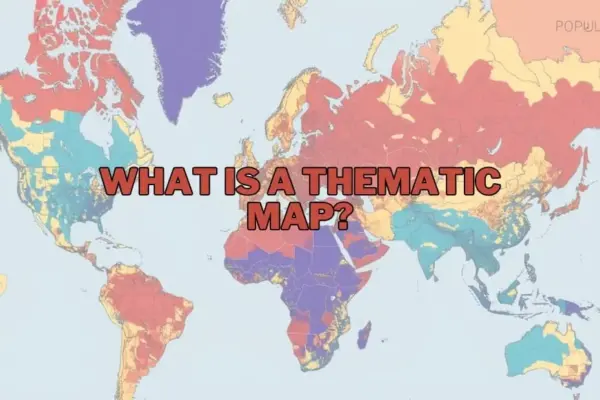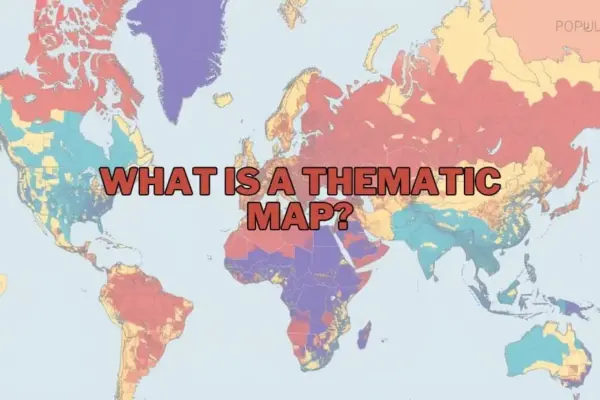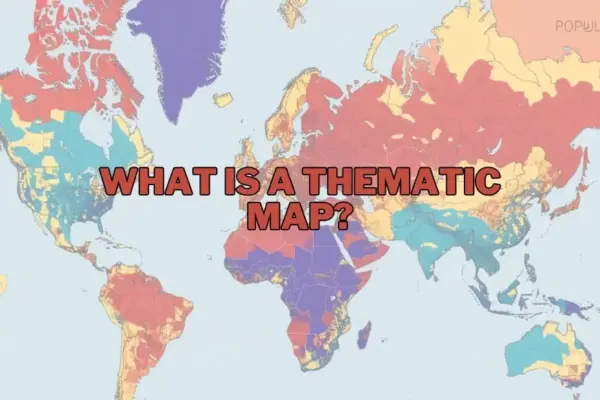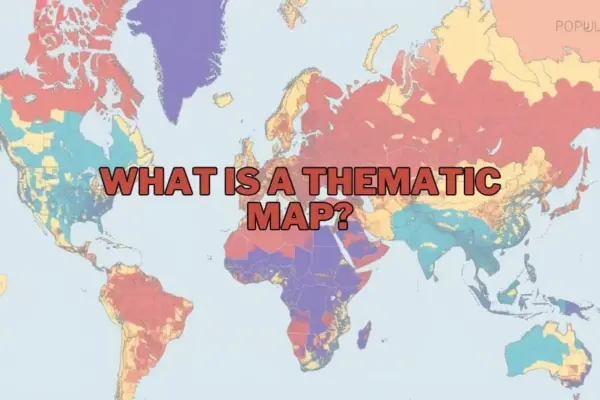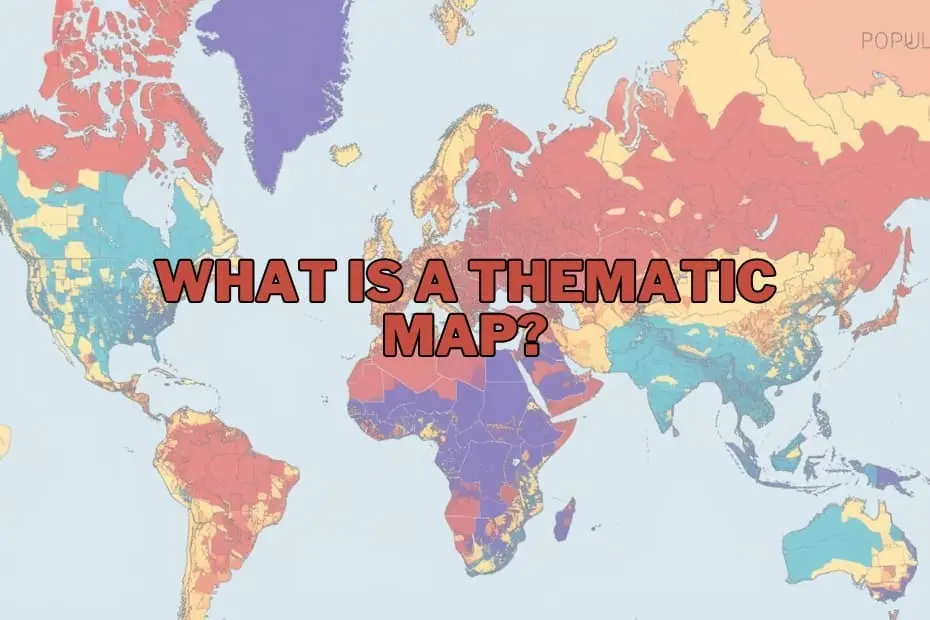
Maps have long served as fundamental tools for human orientation, enabling travelers to chart courses across unknown terrains and navigate physical geography. However, in the modern era of data science and spatial analysis, cartography extends far beyond the simple display of roads, coastlines, and municipal borders. Today, maps function as sophisticated instruments for storytelling, pattern recognition, and strategic decision-making.
At the center of this cartographic evolution is the thematic map—a specialized visual display designed to illustrate specific data themes, spatial variations, and abstract distributions across geographic space. Unlike general reference maps that prioritize positional navigation, thematic maps transform abstract raw datasets into visual spatial narratives, allowing researchers, policymakers, and analysts to uncover underlying trends that might otherwise remain obscured within complex spreadsheets.
Defining the Thematic Map
A thematic map is a map specifically designed to emphasize a particular theme, topic, or subject area tied to geographic locations. Rather than focusing on primary physical features like highways, mountain ranges, or administrative landmarks, a thematic map utilizes cartographic techniques—including variations in color, symbol size, density, or shading—to illustrate spatial patterns connected to a selected variable.
These variables can encompass a vast spectrum of physical, human, and environmental phenomena. Common subjects represented on thematic maps include population density, regional climate conditions, economic activity, public health metrics, and land-use classifications. While a standard reference map seeks to answer the fundamental question of where a feature is located physically, a thematic map addresses questions regarding how a specific phenomenon is distributed across space, how intense it is in particular locations, and how it compares across different regions.
Through this specialized focus, thematic mapping serves as a bridge between quantitative data analysis and geographic context, offering a visual method for interpreting complex spatial dynamics.
Purpose and Importance of Thematic Maps
The core purpose of a thematic map is the effective communication of spatial data. In an increasingly data-driven world, huge volumes of location-based information are generated continuously. Raw numbers organized in tables or databases are often difficult to interpret quickly, especially when attempting to understand geographic relationships. Thematic mapping solves this challenge by converting non-visual numerical data into clear, intuitive geographic patterns.
The importance of these maps lies in their capacity to simplify complex relationships without sacrificing essential spatial context. For example, in environmental science and policy, a thematic map can clearly illustrate how broader climate shifts impact agricultural productivity across different climate zones. In urban planning and government administration, thematic maps can highlight demographic shifts, enabling officials to see precisely where population growth is accelerating and where public infrastructure demands will be highest.
Whether applied in public health tracking, academic research, commercial market analysis, or governmental policy design, thematic maps provide actionable spatial intelligence. By rendering complex distributions visible, they enable stakeholders to make informed, data-driven decisions rooted in geographic realities.
Types of Thematic Maps
Thematic cartography encompasses several distinct map types, each suited to specific types of quantitative or qualitative data and analytical goals. Choosing the appropriate thematic presentation depends on whether the underlying data is continuous or categorical, as well as the spatial structure of the information being presented.
- Choropleth Maps: Among the most common thematic formats, choropleth maps use differing color tones, saturations, or shading patterns to represent aggregated data within defined administrative boundaries, such as counties, states, or nations. They are particularly effective for visualizing standardized categorical or discrete metrics, such as average income levels, literacy rates, or population density per square kilometer.
- Isoline (Isopleth) Maps: Isoline maps employ continuous lines to connect points of equal value across a geographic area. This format is ideal for visualizing continuous spatial gradients and environmental phenomena that change gradually across space without conforming to human-made administrative boundaries. Common examples include weather maps featuring isobar lines for atmospheric pressure or isotherm lines for temperature, as well as elevation contour maps and rainfall distribution visualizations.
- Proportional and Graduated Symbol Maps: These maps draw symbols—most frequently circles or squares—over specific geographic points or area centroids, with the size of the symbol scaled proportionally to the magnitude of the underlying data metric. Proportional symbol maps are useful for comparing absolute totals, such as total energy production per facility or total population per city, while maintaining geographic positioning.
- Dot Density Maps: Dot density maps place uniform dots across a geographic area, where each dot represents a specific quantity of a given phenomenon. By adjusting dot density, cartographers can display visual clusters and spatial concentrations, effectively illustrating how phenomena like population or agricultural yield are dispersed within a region.
- Cartograms: Cartograms deliberately distort the geographic geometry or spatial scale of regions based on a chosen mapping variable. Rather than mapping physical area accurately, a cartogram resizes regions proportionally to metrics such as total population or economic output, offering a striking visual depiction of global or regional disparities.
Key Elements of a Thematic Map
Constructing an effective and accurate thematic map requires deliberate attention to key design elements. Because thematic maps convey conceptual data rather than simple geographic terrain, clear cartographic design is essential to prevent misinterpretation.
- Clear A precise title provides necessary context by defining the map’s specific theme, geographic scope, and timeframe.
- Legend or Key: The legend serves as the primary visual translator for the map. It must clearly define what specific colors, shading gradients, symbols, or line styles represent in terms of data values or categories.
- Scale Indicator: Even though thematic maps emphasize data themes over precise navigation, a scale bar or ratio remains critical for understanding geographic distance and territorial extent.
- Orientation (North Arrow): Proper spatial orientation ensures that readers can evaluate directional trends, such as north-south climatic variations or east-west economic corridors.
- Data Source and Attribution: Citing the original source of the underlying dataset establishes credibility, allows for verification, and ensures transparency regarding data accuracy and collection standards.
- Color Schemes and Visual Hierarchy: The visual design—specifically the choice between sequential, diverging, or qualitative color schemes—must align with the mathematical nature of the data to avoid visually misleading the audience.
Applications Across Industries and Governance
The application of thematic mapping extends across a wide array of professional fields, academic disciplines, and public sector operations:
- Public Health and Epidemiology: Public health officials rely heavily on thematic maps to track disease outbreaks, map health disparities, evaluate regional access to healthcare facilities, and direct emergency medical resources during crises.
- Urban and Environmental Planning: Municipal planners use thematic visualizations to evaluate land-use zoning, analyze traffic congestion patterns, monitor urban heat island effects, and plan public transit networks.
- Environmental Science and Resource Management: Earth scientists and ecologists utilize isoline and choropleth mapping to track deforestation rates, monitor wildlife habitat fragmentation, analyze soil moisture levels, and study long-term climate change impacts.
- Business Analytics and Market Research: Commercial enterprises deploy thematic maps to conduct trade area analysis, evaluate site selection for new retail locations, identify underserved consumer demographics, and optimize supply chain logistics.
- Historical and Demographic Analysis: Historians and sociologists use thematic maps to track historical migration patterns, analyze territorial changes over time, and evaluate shifts in socioeconomic demographics across decades.
Advantages of Thematic Maps
The primary advantage of thematic mapping is its ability to make complex numerical and spatial relationships instantly understandable. By translating abstract quantitative data into intuitive visual patterns, thematic maps accelerate data comprehension and highlight spatial nuances that might be missed in traditional data formats.
Furthermore, thematic maps facilitate rapid pattern recognition, allowing analysts to instantly detect regional clusters, spatial corridors, and geographical anomalies. They provide a unified platform for combining socio-economic data with physical geographic features, revealing how human behavior and environmental factors interact across space.
Limitations and Methodological Considerations
Despite their significant utility, thematic maps carry inherent analytical and visual limitations that cartographers and decision-makers must navigate carefully.
A primary challenge involves data aggregation and boundary selection. In choropleth mapping, aggregated data presented within arbitrary political boundaries can mask significant localized variations within those boundaries—a phenomenon closely tied to spatial scale dependencies.
Additionally, visual bias can distort reader perception. On standard choropleth maps, large geographic administrative units naturally dominate visual space, which can inadvertently cause viewers to overemphasize sparsely populated large regions while overlooking densely populated smaller urban centers. Furthermore, thematic maps typically offer a static representation of dynamic, continuously evolving phenomena, requiring frequent data updates to remain accurate and relevant over time.
Software Tools Driving Modern Thematic Cartography
Advances in digital computing and Geographic Information Systems (GIS) have democratized the creation of thematic maps, enabling professionals and researchers across disciplines to produce sophisticated spatial visualizations.
- Geographic Information Systems (GIS): Professional GIS software suites, including open-source platforms like QGIS and comprehensive enterprise solutions like ArcGIS, provide robust toolsets for spatial data management, advanced cartographic styling, complex spatial statistics, and precise thematic map production.
- Data Visualization and Business Intelligence Platforms: Modern visual analytics tools such as Tableau and Power BI have integrated intuitive mapping features, allowing business analysts to build dynamic, interactive thematic map dashboards directly from corporate databases.
- Web Mapping and Open-Source Libraries: Developers and digital cartographers increasingly utilize web-based mapping platforms and JavaScript libraries to build responsive, interactive thematic maps designed for public dissemination across news media, educational portals, and web applications.
Frequently Asked Cartographic Questions
What is the primary difference between a thematic map and a reference map?
A reference map focuses on displaying physical geography, boundaries, and infrastructure—such as roads, rivers, cities, and terrain—to assist with general orientation and navigation. In contrast, a thematic map focuses on visually representing a specific dataset or theme, such as climate metrics, economic output, or population density, across geographic space.
Can thematic maps be used to analyze historical data?
Yes, thematic mapping is a valuable tool for historical analysis. Cartographers and historians frequently construct thematic maps using archival data to visualize historical demographic shifts, military movements, changing agricultural patterns, or urban growth over long periods.
What software platforms are recommended for beginners entering thematic mapping?
For beginners looking to develop thematic maps without extensive cartographic training, user-friendly options like Tableau offer accessible drag-and-drop spatial visualization interfaces. For those interested in learning complete geographic information software, QGIS offers a free, open-source environment backed by an active global support community.
How do analysts select the appropriate thematic map format for their data?
Selection depends on the structure and scale of the dataset. Continuous environmental data that varies smoothly across space—such as temperature or atmospheric pressure—is best suited for isoline maps. Aggregated demographic or socioeconomic metrics linked to administrative boundaries are effectively displayed using choropleth maps, while discrete spatial point data is better represented via proportional symbol or dot density maps.