In the modern workplace, data visualization has become a ubiquitous tool for communication. Professionals across industries routinely rely on charts, graphs, and dashboards to present operational metrics, track performance, and guide strategic decisions. Yet, a fundamental misconception frequently undermines these efforts: the belief that minimalism is an end in itself, and that removing all textual context from a visual presentation automatically makes it clearer.
A recent analysis of data communication practices challenges this minimalist orthodoxy, suggesting that the effectiveness of a data display depends far less on word count reduction and far more on whether the chosen text actually helps the audience understand and act upon the information.
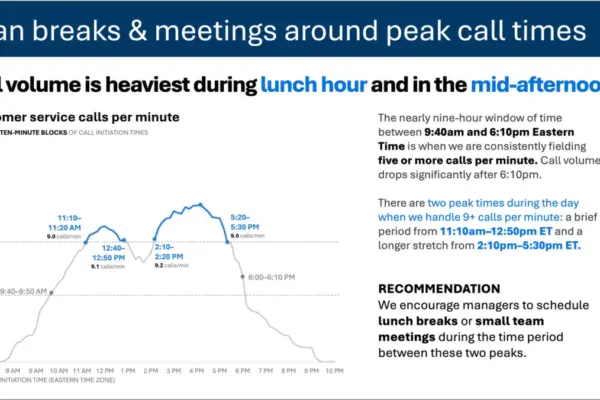
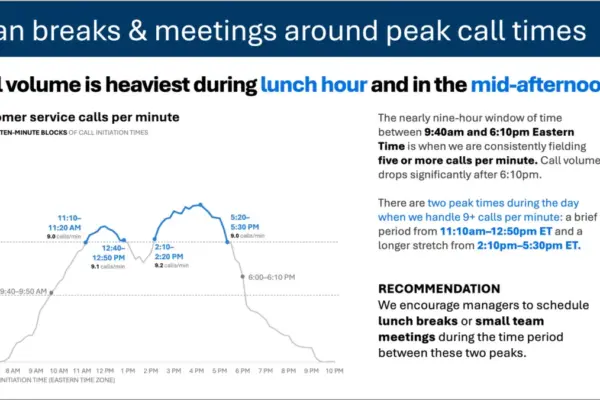
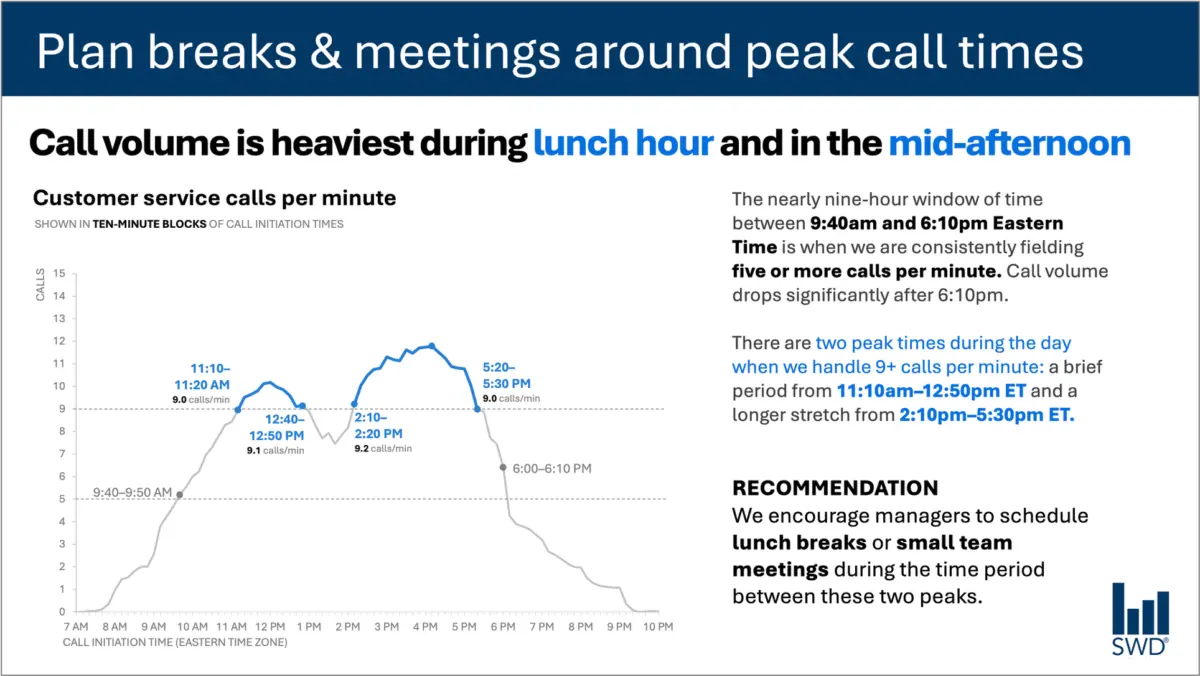
To illustrate this principle, consider a standard operational graph tracking customer service call volume throughout a typical business day. Viewed in isolation, the chart reveals a clear, predictable pattern: call volumes begin to climb in the morning hours, remain consistently elevated through much of the standard workday, and reach distinct peaks around the lunch hour and again in the mid-afternoon.
For a casual observer, simply recognizing this temporal pattern might satisfy a basic curiosity about customer behavior. However, data visualization is rarely intended for passive observation. When the audience consists of operational staffing managers—professionals responsible for scheduling breaks, allocating shift coverages, and managing workforce capacity—the nature of the communication changes fundamentally. The graph is not merely being presented for them to admire; it is being shown because they have the power to act upon its underlying realities.
Recognizing this operational context alters every decision a communicator makes regarding the surrounding text. Instead of leaving the audience to interpret the chart independently, an effective presentation frames the data with purpose. A strategic takeaway title placed at the top of the display—such as "Plan breaks and meetings around peak call times"—immediately informs staffing managers of what matters most in the analysis. Meanwhile, a descriptive graph title, such as "Customer service calls per minute," clearly establishes what the audience is looking at.
Furthermore, precise annotations can be integrated to pinpoint exactly when call volume crosses critical thresholds, offering vital context regarding the two distinct peak periods throughout the day. The final recommendation synthesizes these insights into a concrete, actionable directive: schedule lunch breaks and small team meetings precisely between the peak intervals.
Each component of this text performs a distinct, necessary job. This dynamic highlights a critical flaw in the prevailing corporate obsession with brevity. While minimizing text is often treated as an absolute virtue in slide design, stripping away all surrounding commentary does not inherently make a graphic more useful. A completely stripped-down chart might achieve a sleek, minimalist aesthetic, but it frequently fails to communicate effectively because it leaves the audience to guess the operational implications. True clarity requires adding the right words, in the right places, to ensure the communication succeeds.
Different Words Do Different Jobs
When deciding which elements belong on a graph, dashboard, or presentation slide, communicators must begin by evaluating the specific needs of their audience. Data is rarely self-explanatory to everyone in the room; different textual elements serve distinct cognitive functions that guide the viewer from raw observation to meaningful comprehension.
A takeaway title, for example, is designed to communicate the primary message or required action upfront. A descriptive graph title acts as an orienting mechanism, helping the audience quickly understand the baseline subject matter of the visual. Direct labels can be utilized to eliminate the mental friction of constantly glancing back and forth between the data series and a separate legend. Meanwhile, annotations provide the narrative narrative tissue of the slide—explaining anomalies, drawing attention to critical inflection points, and adding contextual details that cannot be derived from the numbers alone. Additional contextual elements, such as axis titles, footnotes, and source citations, supply supplementary rigor when deeper scrutiny is required.
It is important to note that not every graph requires every single one of these components. The objective is not to crowd the visual space, but to be deliberate and purposeful in design choices. Communicators must continually ask themselves what their audience needs to understand the material, what they should know or do as a result of seeing it, and where a few well-chosen words could eliminate ambiguity or make the central point unmistakable. Once those functional elements are established, any surrounding text that fails to add genuine value should be eliminated.
The Insight Has to Come from Somewhere
As organizations increasingly turn to artificial intelligence to accelerate content creation and data analysis, the distinction between surface-level observation and genuine insight becomes even more pronounced. This evolution places a renewed emphasis on the irreplaceable role of human expertise in the communication process.
Imagine feeding raw call-volume data into an advanced artificial intelligence system and asking it to generate a presentation slide. Equipped with pattern-recognition capabilities, the AI would likely succeed in identifying the underlying trends. It could accurately report that call volume peaks around lunchtime and during the mid-afternoon, and it could effortlessly synthesize that observation into a polished, grammatically correct sentence.
Yet, a polished description does not automatically constitute a strategic insight.
A truly useful recommendation emerges only when raw data is synthesized with broader organizational context. To transform numbers into actionable intelligence, a communicator must understand who the audience is, why they are reviewing the information, what they genuinely care about, and what decisions fall directly within their sphere of control. Once it is established that the audience consists of staffing managers, a standard temporal pattern transforms from a mere descriptive statement into an operational roadmap.
This principle forms the core of modern data storytelling frameworks: humans must provide the necessary contextual foundation before asking artificial intelligence to assist with communication. While AI tools are exceptionally capable of helping writers find concise wording, suggesting alternative titles, refining direct labels, and testing different ways to articulate a complex idea, they lack lived organizational experience. Someone within the enterprise must understand the operational landscape well enough to recognize what truly matters.
A polished sentence can never serve as a substitute for true human insight. Professionals who have spent extended periods working directly with specific datasets possess a deep institutional knowledge that AI simply cannot replicate. They know the historical background of the metrics, they understand what operational changes occurred to influence a particular trend, and they grasp the nuanced organizational priorities of their audience. An experienced analyst may recognize that a seemingly minor fluctuation in a graph is actually a critical warning sign, while another movement that appears visually prominent is entirely inconsequential.
Ultimately, effective data communication requires bringing that deep contextual knowledge directly to the presentation slide. The goal of professional reporting and visual design is never to maximize or minimize word counts arbitrarily. The true objective remains clear: utilizing the right words to perform the right jobs, making complex thinking visible, and ensuring that data successfully translates into meaningful action.