In the modern corporate and analytical landscape, professionals are frequently told that when it comes to presenting data, less is almost always more. Slides should be clean, visuals should be uncluttered, and text should be stripped down to the bare minimum. But a growing perspective within data storytelling suggests that this minimalist mantra can often strip data of its actual utility, leaving audiences with pretty charts that fail to drive real-world action.
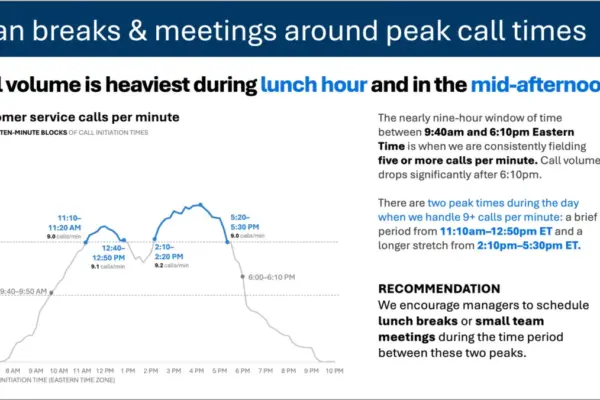
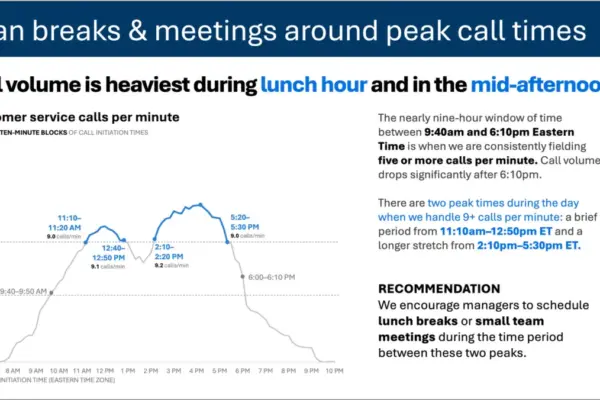
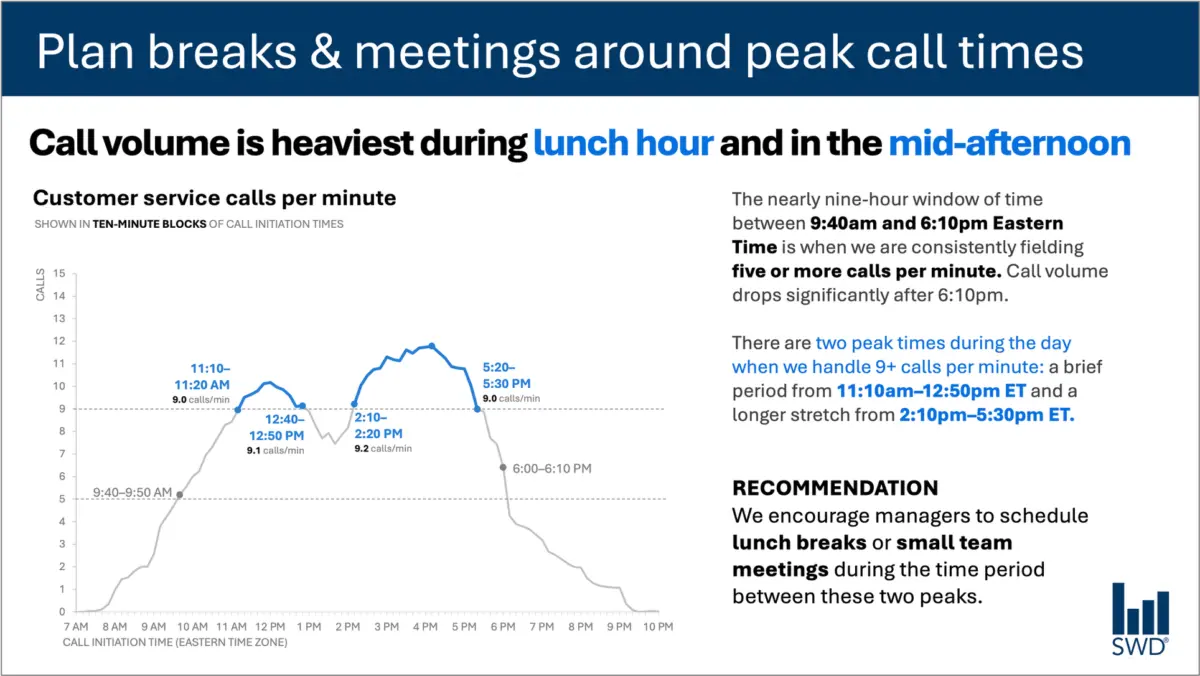
Consider a common business scenario: a graph illustrating customer service call volume throughout a standard business day. Viewed in isolation, the visual pattern is straightforward enough. Calls begin to climb steadily in the morning hours, remain consistently high across the major blocks of the workday, and form distinct peaks right around the lunch hour and again in the mid-afternoon.
On its own, this chart is merely a record of customer behavior. But the primary audience viewing this data is rarely looking at it out of casual curiosity. They are staffing managers—professionals whose daily responsibilities depend on anticipating customer demand to schedule personnel effectively. The fundamental purpose of showing them this information is not just to inform them that customer call patterns exist, but to enable them to do something meaningful with that knowledge.
Recognizing that specific audience context completely shifts how a communicator approaches text design on a slide or data dashboard. Instead of leaving the chart to speak for itself, every piece of surrounding language must be engineered to serve a precise function.
A prominent takeaway title—such as a directive instruction to "Plan breaks and meetings around peak call times"—immediately signals to staffing managers what matters most. Meanwhile, a descriptive graph title like "Customer service calls per minute" grounds the audience in what they are actually looking at on the screen. Thoughtful annotations can then pinpoint the exact moments when call volume crosses critical operational thresholds, offering essential context about the two distinct peak periods. Finally, a clear recommendation translates the raw data into a concrete administrative action: scheduling lunch breaks or small team meetings exclusively during the lulls between the peaks.
Each bit of text on that slide has a distinct job to perform. This realization challenges the prevailing industry obsession with reducing word counts as though brevity were an inherent virtue in data presentation. Removing all surrounding text from a graph might create a sleek, minimalist aesthetic, but it fundamentally fails if it compromises the usefulness of the communication. Effective communication requires adding the right words, placed in the right spots, to make the data actionable.
Different words do different jobs
When professionals sit down to decide which words belong on a graph, slide, or report, the starting point should always be a rigorous assessment of what the audience needs to extract from the material. Different textual elements carry out entirely different functions within a visual layout.
A takeaway title is designed to communicate the overarching main point or prompt a specific action. A descriptive graph title exists to orient the audience, ensuring they understand the metrics and units they are evaluating. Direct labels can be deployed to eliminate the tedious cognitive work of referring back and forth between data points and a separate legend. Annotations fulfill a narrative role by explaining what happened, drawing attention to anomalies or critical thresholds, and adding context that cannot possibly be inferred from the numbers alone. Meanwhile, traditional elements such as axis titles, footnotes, and source information remain available to provide necessary technical detail when deeper scrutiny is required.
Crucially, not every graph requires every single one of these components. The ultimate objective is deliberate design. Communicators must pause to ask fundamental questions about their audience: What does the viewer need to understand this visual immediately? What should they know or actually do as a result of seeing it? Where could a few well-chosen words eliminate lingering confusion or make an underlying point completely unmistakable?
Once those questions are answered, the remaining task is to ruthlessly eliminate the clutter—getting rid of any words that fail to actively help the audience comprehend and act upon the information.
The insight has to come from somewhere
This nuance highlights the irreplaceable role of human expertise, particularly in an era where artificial intelligence is increasingly leveraged to generate content and analyze datasets.
Imagine handing raw call-volume data to an advanced AI model and instructing it to build a presentation slide. The technology would likely parse the numbers with ease, identifying the underlying pattern without breaking a sweat. It might accurately report that call volume spikes around lunchtime and again in the mid-afternoon, and it could effortlessly generate a polished, grammatically flawless sentence describing that behavioral trend.
Yet, a polished description is not yet an insight.
The transition from a mere observation to a genuinely useful recommendation requires combining raw data with deep, contextual understanding. It requires knowing who the audience actually is, why they are looking at the information in the first place, what they genuinely care about, and—most importantly—what operational decisions fall within their direct control. Once a human establishes that the audience consists of staffing managers, the data pattern transforms from a passive observation into an actionable blueprint.
This principle forms the cornerstone of modern data communication frameworks: human analysts must supply the critical context before asking automated tools to assist with communication. AI can certainly aid in finding concise wording, suggesting alternative titles and labels, or testing different ways to articulate a complex concept. However, a human being must still understand the operational reality well enough to recognize what truly matters.
A well-written sentence does not automatically equate to deep insight. Professionals who spend extensive time working closely with data possess an institutional memory that algorithms simply cannot replicate. They know the organizational history. They know what operational changes occurred last quarter. They understand broader corporate goals and the exact pressures weighing on their audience’s minds. A human expert might look at a complex chart and immediately recognize that one minor movement is deeply consequential while another visually prominent spike is entirely normal and irrelevant.
Bringing that specialized knowledge to the slide is what transforms routine data sharing into effective communication. The ultimate goal is never about maximizing or minimizing word counts for their own sake. Success lies in deploying the right words to do the right jobs, making complex human thinking visible to the people who need it most.