In the modern corporate landscape, data visualization has increasingly become the bedrock of operational decision-making. Yet, professionals across industries frequently misinterpret what makes a graphic successful, often falling into the trap of assuming that minimalism—stripping away as much text as possible—is the ultimate standard of design. Recent insights into data communication challenge this prevailing wisdom, highlighting that the true effectiveness of a chart or presentation slide lies not in how sparse it is, but in how purposefully its surrounding text guides the audience toward a meaningful action.
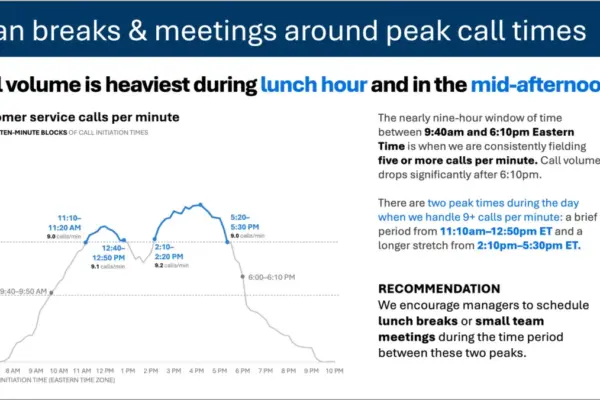
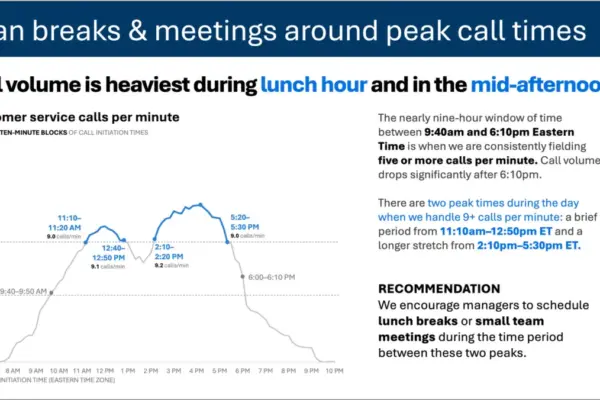
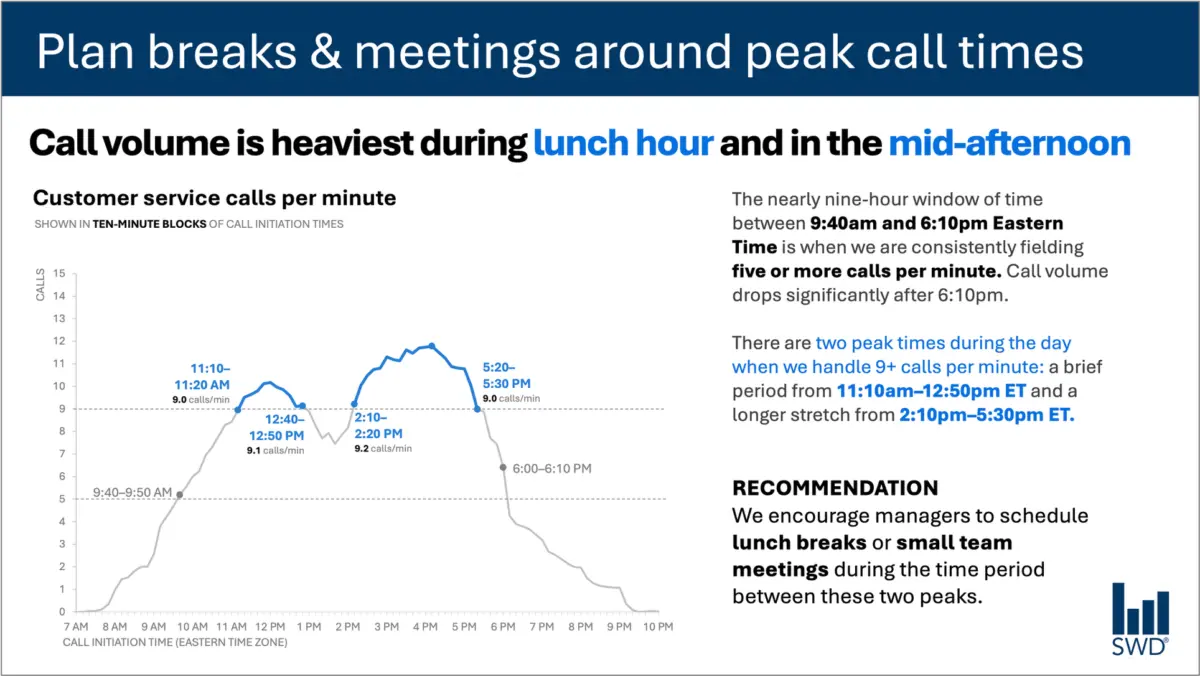
Consider a standard line graph illustrating customer service call volume throughout a typical business day. Viewed in isolation, the chart reveals a predictable pattern: calls begin to climb steadily in the morning, remain at an elevated plateau through the vast majority of the standard workday, and spike notably during two distinct windows—around the lunch hour and once again in the mid-afternoon.
On its own, this visualization is merely a picture of chronological data. However, the context shifts dramatically when considering who is actually looking at the graphic and why. If the audience consists of staffing managers who oversee schedules, support queues, and break rotations, the visualization ceases to be an academic exercise in trend-spotting. It becomes an operational tool designed to influence behavior. The data is only as valuable as the decisions it enables, and those decisions rely heavily on how the information is framed through language.
This realization fundamentally transforms how text is deployed alongside data. A functional approach replaces generic descriptions with targeted guidance. For instance, a prominent takeaway title can state explicitly: Plan breaks and meetings around peak call times. This single sentence immediately signals to staffing managers what matters most in the data. Meanwhile, a descriptive graph title, such as Customer service calls per minute, grounds the audience and clarifies precisely what metric they are evaluating.
Furthermore, precise annotations can be integrated to pinpoint the exact moments when call volumes cross critical operational thresholds, adding necessary context to the dual peak periods. Finally, a clear recommendation translates the visual evidence into a concrete action plan, advising leadership to schedule lunch breaks or small team meetings exclusively during the lulls between the peaks.
Every single element of text on the slide has a distinct job to perform. This principle dismantles the common misconception that reducing word count is universally beneficial. Simply stripping away all surrounding text to achieve a stark, minimalist aesthetic might make a slide look cleaner on the surface, but it strips away its utility. True communication requires adding the right words to ensure the message is understood and acted upon.
Different words do different jobs
When professionals sit down to determine which words belong on a graph or presentation slide, the starting point must be a rigorous assessment of what the audience requires to make sense of the information. Words are not merely decorative ornaments or filler for empty space; they are functional components of a visual argument.
A takeaway title bears the responsibility of communicating the core message or the primary action required by the data. A descriptive graph title serves to orient the audience, ensuring there is zero ambiguity about what is being measured. Direct labels can be employed to eliminate the cognitive friction of forcing viewers to constantly cross-reference a separate legend. Annotations fulfill a narrative function, explaining historical context, calling attention to anomalies, or highlighting insights that are entirely invisible if one merely looks at the raw numbers on the page. Meanwhile, traditional elements such as axis titles, footnotes, and source information remain available to provide secondary depth and credibility when supplementary details are warranted.
It is equally important to recognize that not every graph requires every single one of these components. The ultimate objective is deliberate design. Communicators must pause to ask fundamental questions about their audience: What does the viewer need to understand this visual immediately? What should they know or do as a direct result of viewing it? Where could a few well-chosen words eliminate potential confusion and make the overarching point unmistakable?
Once those questions are answered, the superfluous text—the words that are not actively helping the audience comprehend the narrative—can be safely discarded. The goal is precision, not brevity for its own sake.
The insight has to come from somewhere
This nuanced balance between visual data and supporting language underscores why the human element remains irreplaceable, even as organizations increasingly turn to artificial intelligence to streamline their workflows.
Imagine feeding raw call-volume data into an advanced artificial intelligence tool and asking it to generate a presentation slide. An AI model is fully capable of identifying patterns within that dataset. It could easily deduce that call volume reaches its highest points around the lunch hour and again in the mid-afternoon, and it could effortlessly synthesize that observation into a polished, grammatically correct sentence.
Yet, describing what the data shows is not the same as generating an insight.
A truly useful recommendation requires synthesizing raw data with deeper contextual layers that an algorithm cannot inherently perceive. Who is the specific audience? Why are they reviewing this particular graphic at this specific moment? What metrics and outcomes do they genuinely care about? What operational decisions fall directly within their sphere of control? Once a human designer establishes the crucial context that the audience consists of staffing managers, a mechanical data pattern transforms into a powerful, actionable directive.
This distinction sits at the heart of modern data communication frameworks, emphasizing the necessity of supplying AI models with comprehensive context before asking them to assist with communication tasks. Artificial intelligence can undeniably aid in the search for concise wording, suggest alternative titles, draft labels, and test various ways of articulating a complex idea. However, a human operator must still understand the underlying business situation well enough to recognize what truly matters.
A polished sentence produced by a machine is not an insight. Professionals who spend extended periods working closely with specific datasets possess institutional knowledge that technology lacks. They know the operational history, they understand recent policy changes that might have triggered an anomaly, and they grasp the broader organizational landscape. They can intuitively recognize that one minor movement in a graph represents a critical operational crisis, while another visually prominent spike is entirely inconsequential.
Bringing that accumulated human knowledge to the design process allows communicators to use language to make their thinking visible. Ultimately, effective data storytelling rejects the false choice between more words and fewer words. The only metric that matters is whether the chosen words are doing their assigned jobs effectively, bridging the gap between raw data and decisive human action.