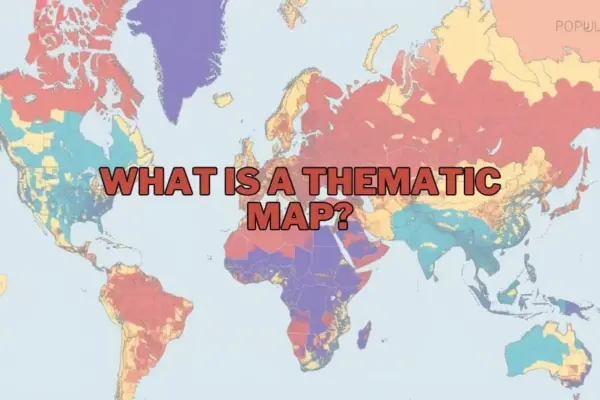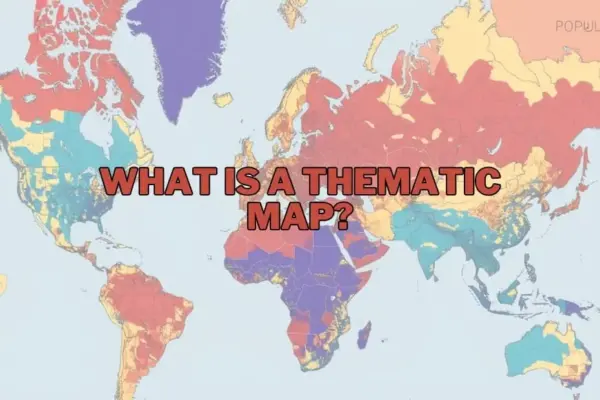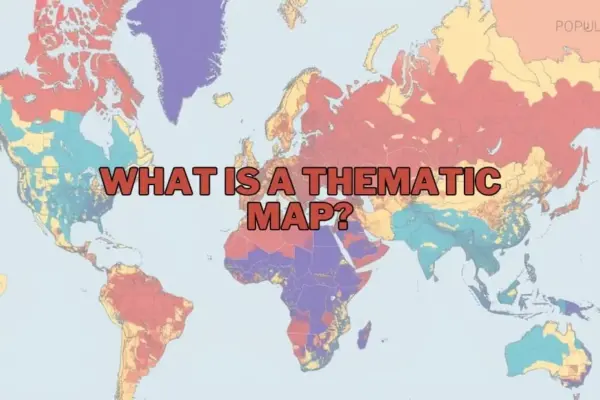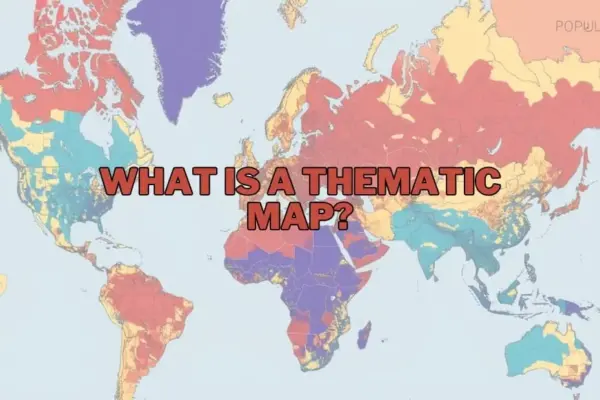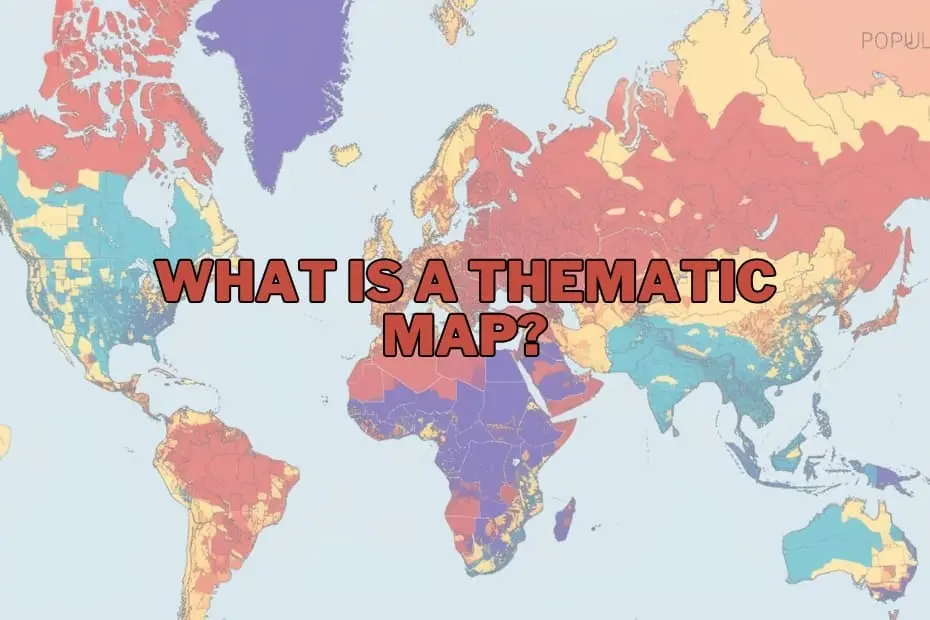
In contemporary data visualization and geographic analysis, maps have evolved far beyond basic instruments used merely for navigation. While traditional maps guide travelers from one location to another, modern visual cartography serves as a sophisticated medium for telling data-driven stories, identifying hidden geographic trends, and interpreting complex statistical information. Among the diverse techniques used by cartographers and data analysts, thematic maps have emerged as an essential class of visualization designed to render abstract data meaningful across physical space.
Unlike general reference maps, which focus on displaying physical features such as highways, rivers, terrain, and political boundaries, a thematic map focuses on a single subject or specific domain. Whether illustrating regional population density, shifting global climate patterns, localized unemployment rates, or broad economic activity, thematic maps prioritize spatial relationships over general geography. By translating quantitative and qualitative metrics into structured visuals—utilizing strategic color gradients, thematic symbols, and calculated shading—these specialized maps allow researchers, policy experts, and organizations to recognize spatial distributions that would remain obscured within standard statistical tables.
Purpose and Importance of Thematic Maps
The core purpose of a thematic map lies in its capacity to communicate complex spatial information clearly and efficiently. Raw numerical datasets often hide critical geographical relationships, making it difficult to evaluate how variable factors interact across different locations. By mapping variables relative to geography, thematic visualization uncovers underlying patterns, spatial correlations, and structural trends that inform real-world decision-making.
The significance of these visual tools spans across numerous academic, commercial, and governmental disciplines. For instance, environmental scientists rely on thematic maps to evaluate how climate change influences agricultural productivity and water scarcity across different biomes. Similarly, urban planners utilize thematic spatial analysis to determine how rapid population growth impacts local infrastructure, transportation networks, and housing availability. By simplifying intricate datasets into digestible visual frameworks, thematic maps provide actionable insights for researchers, business analysts, students, and public officials alike.
Types of Thematic Maps
Cartographers employ several distinct categories of thematic maps depending on the nature of the underlying data and the analytical narrative required. Choosing the appropriate mapping style depends largely on whether the dataset represents continuous environmental phenomena or discrete, boundary-based administrative statistics.
- Choropleth Maps: Among the most common thematic map types, choropleth maps apply varying color intensities or patterns to predefined geographic areas, such as countries, states, or census tracts. They are ideally suited for displaying standardized aggregate data, such as regional population densities, median income levels, or percentage-based economic metrics.
- Isoline (Isopleth) Maps: Designed to represent continuous spatial data, isoline maps utilize continuous lines to connect geographic points of equal value. These maps are widely utilized in meteorology and environmental science to map continuous physical phenomena, such as atmospheric pressure gradients, rainfall distribution, or temperature thresholds.
- Dot Density Maps: Using individual dots to represent a specified quantity of a phenomenon, dot density maps showcase the spatial scatter and concentration of variables. They excel at illustrating spatial distribution across regional boundaries without implying uniform dispersion within an entire administrative zone.
- Proportional Symbol Maps: These visualizations scale geometric symbols—such as circles or squares—proportionally to the magnitude of the data variable at specific geographic points. They effectively display localized quantities, such as urban population sizes or site-specific industrial production outputs.
- Cartograms: Cartograms deliberately distort actual geographic space, scaling mapped areas according to the statistical variable being measured—such as total national population or energy consumption—rather than physical land area.
Key Elements of an Effective Thematic Map
Designing an accurate and effective thematic map requires integrating core cartographic principles to ensure clarity, legibility, and technical accuracy. A well-constructed map must balance technical precision with clear visual communication.
- Clear A precise title provides immediate context, identifying both the variable being measured and the geographic region covered.
- Map Legend or Key: The legend translates visual variables—such as color ramps, symbol sizes, or line values—into precise numerical ranges or qualitative categories.
- Scale and Orientation: Including a scale bar and orientation indicator (such as a north arrow) maintains geographic accuracy and helps readers gauge distance and spatial relationships.
- Symbology and Visual Hierarchy: Strategic selection of colors, shading, and symbols establishes a logical hierarchy, ensuring that high values or critical hotspots attract immediate reader attention without overwhelming background features.
- Data Source Attributions: Documenting the underlying data sources ensures transparency, credibility, and academic rigor in professional spatial analysis.
Applications of Thematic Maps Across Disciplines
The utility of thematic mapping extends far beyond physical geography, providing value across numerous modern industries and fields of study:
- Public Health and Epidemiology: Health officials rely on thematic visual mapping to track disease outbreaks, analyze regional healthcare accessibility, identify health risk factors, and deploy emergency medical resources to high-need zones.
- Environmental Management and Climate Science: Climate researchers use thematic visualizations to monitor environmental changes, track regional deforestation rates, project sea-level rise, and analyze agricultural yields under changing atmospheric conditions.
- Urban Planning and Infrastructure: Municipal authorities analyze demographic shifts, traffic congestion trends, and residential zoning patterns to direct public transportation investments and optimize emergency response infrastructure.
- Business Intelligence and Market Research: Commercial enterprises evaluate regional consumer demographics, purchasing power, and geographic market saturation to determine optimal site locations for new retail outlets or service hubs.
Advantages of Spatial Visualizations
The primary advantage of thematic maps is their ability to transform complex quantitative datasets into intuitive visual formats. Instead of evaluating thousands of individual spreadsheets rows, decision-makers can rapidly identify geographic hotspots, regional disparities, and spatial clustering.
Furthermore, thematic visual tools bridge the gap between technical data scientists and non-technical stakeholders. By highlighting clear geographical patterns, these visual assets facilitate public policy discussions, support evidence-based business strategies, and enhance educational communication across academic subjects.
Limitations and Cartographic Considerations
Despite their significant visual advantages, thematic maps present inherent design challenges and potential limitations that analysts must navigate carefully:
- Data Aggregation and Generalization: Standardizing data into visual zones can obscure internal variations within a single zone, potentially creating false impressions of uniformity across large administrative areas.
- Classification Bias: The visual interpretation of a map can change drastically depending on the chosen data classification method (such as equal intervals or natural breaks) and selected color spectrums, which can inadvertently misrepresent underlying data trends.
- Dependency on Spatial Data Quality: The visual accuracy of any thematic map depends entirely on the precision and timeliness of the underlying spatial dataset. Incomplete or outdated raw metrics inevitably lead to flawed geographic interpretations.
Software Tools and Mapping Technologies
Advancements in digital geographic information technology have made spatial visualization tools more accessible to researchers, data analysts, and non-specialists alike.
Modern Geographic Information Systems (GIS), such as QGIS and ArcGIS, offer comprehensive cartographic capabilities for handling complex multi-layered spatial data, calculating spatial statistics, and rendering high-precision thematic maps. Additionally, modern data visualization platforms like Tableau allow users to generate interactive regional thematic graphics directly from structured statistical tables. These software innovations enable analysts across diverse sectors to turn complex spatial datasets into clear visual assets that drive strategic decision-making.
Frequently Asked Questions
What is the primary difference between a thematic map and a reference map?
A thematic map focuses on visual data trends related to a specific theme or topic—such as climate patterns or population density—across a geographic area. In contrast, a reference map focuses primarily on identifying general geographic features, such as roads, rivers, cities, and land boundaries, to aid location and navigation.
Can thematic maps be used to analyze historical data?
Yes, thematic maps are frequently used to visualize historical trends and spatio-temporal changes over time. They allow historians and sociologists to map historical demographic shifts, territorial changes, economic movements, and long-term environmental developments.
Which software options are most suitable for beginners creating thematic maps?
For individuals new to cartography and spatial data visualization, platforms like QGIS offer robust open-source GIS capabilities, while visual analytics platforms like Tableau provide intuitive drag-and-drop tools suitable for creating basic thematic map visualizations from tabular data.
How do analysts select the most appropriate type of thematic map for a given dataset?
Selection depends directly on the structure of the data variable being analyzed. Continuous environmental phenomena—such as temperature or atmospheric pressure—are best suited for isoline maps, while discrete regional aggregate data—such as state-level unemployment or population density—are generally best visualized using choropleth maps.
Are thematic maps used exclusively in geographic studies?
No, thematic mapping techniques are widely applied across a range of fields, including business market analysis, public health tracking, urban planning, agriculture, economics, and environmental science.