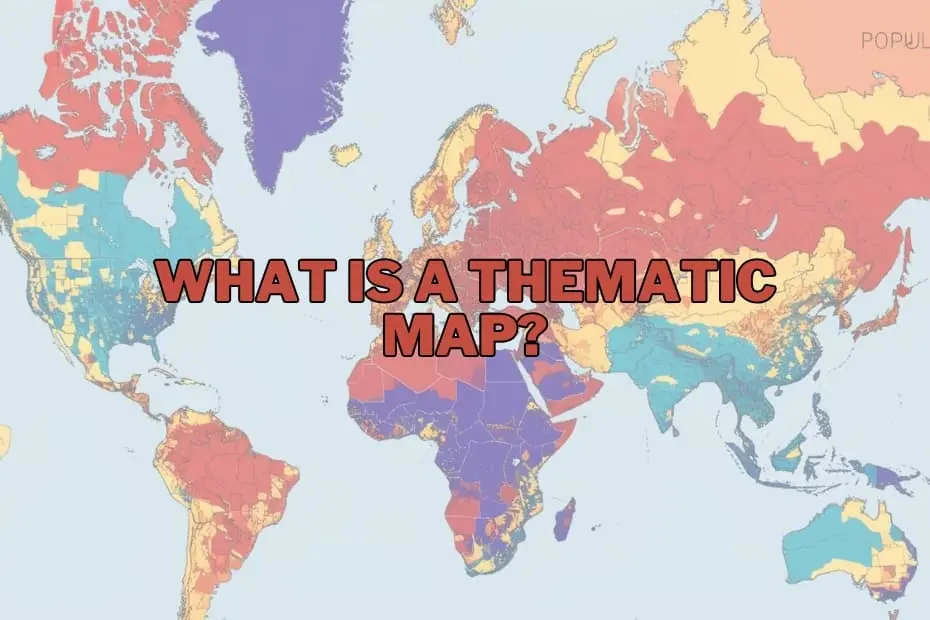
In the modern landscape of geography, data science, and information visualization, maps have evolved far beyond their traditional role as static tools for navigation. Today, they serve as sophisticated instruments for narrative storytelling, pattern recognition, and the decoding of highly complex spatial datasets. While standard reference maps help travelers get from point A to point B, thematic maps offer a deeper analytical perspective. They allow researchers, policymakers, and the public to visualize not just where things are, but how specific phenomena behave across geographic space.
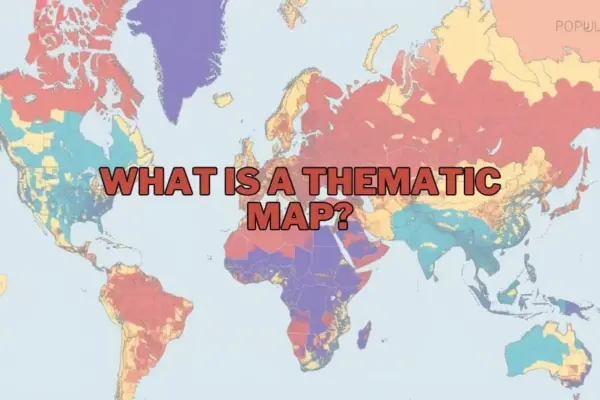
A thematic map is a specialized map designed to visualize data related to a specific theme or subject, such as population density, climatic variations, or regional economic performance. Unlike general reference maps, which prioritize physical and man-made geographic features like roads, rivers, and political boundaries, thematic maps use these features merely as a background canvas. Their primary objective is to emphasize spatial patterns, distributions, and trends, utilizing visual variables such as color gradients, symbols, or shading to highlight how a chosen subject varies across a geographic area.
By transforming raw, tabular data into structured visual narratives, thematic maps provide geographers, urban planners, and analysts with a powerful medium to communicate complex information quickly and intuitively. Whether mapping the spread of an infectious disease or showing how annual rainfall varies across a continent, these maps turn abstract coordinates and statistics into actionable geographic intelligence.
Purpose and Importance of Thematic Maps
The fundamental purpose of a thematic map is to make spatial relationships and distributions immediately apparent to the human eye. Raw data tables containing thousands of data points can be incredibly difficult to interpret. When that same data is projected onto a map, however, hidden correlations, clusters, and outliers suddenly become clear.
Thematic maps are critical in helping society understand the spatial dimensions of major global challenges. For example, they can illustrate how shifting climate patterns directly impact agricultural yields, or how rapid population growth influences urban sprawl and infrastructure demands. By simplifying highly complex, multi-layered datasets, thematic maps democratize information, making scientific, economic, and social data accessible to students, corporate executives, and government officials alike. In fields as diverse as environmental conservation, epidemiology, and retail market research, the ability to visualize data spatially is often the key to making informed, evidence-based decisions.
Types of Thematic Maps
Depending on the nature of the dataset and the specific story an analyst wants to tell, different types of thematic maps can be utilized. Selecting the appropriate map type is crucial for ensuring that the underlying data is represented accurately without misleading the viewer.
Choropleth Maps
The choropleth map is perhaps the most widely recognized type of thematic map. It represents spatial data by shading or coloring predefined administrative areas—such as countries, states, or zip codes—according to a specific scale. Typically, darker shades represent higher densities or magnitudes, while lighter shades indicate lower values. Choropleth maps are highly effective for visualizing regional statistics, such as tax rates, literacy levels, or population density. However, they must be used cautiously, as they can create an illusion of uniform distribution within a single boundary, masking localized variations.
Isoline and Isarithmic Maps
Isoline maps use continuous lines to connect points of equal value across a geographic surface. The most common examples are topographic maps, which use contour lines to show elevation. In thematic mapping, isolines are frequently used in meteorology and climatology to represent continuous phenomena like temperature (isotherms), atmospheric pressure (isobars), or annual precipitation patterns. These maps are ideal for visualizing smooth, uninterrupted transitions across space rather than abrupt changes at administrative borders.
Dot Distribution Maps
Dot distribution, or dot density, maps use individual dots of uniform size to represent the presence or quantity of a specific phenomenon. Each dot can represent a single occurrence (such as a business location or a recorded crime) or a specified unit value (such as 1,000 people or 500 acres of a crop). These maps are excellent for showing spatial density and concentration, allowing viewers to easily identify clusters and sparse areas without the artificial constraints of administrative boundaries.
Graduated and Proportional Symbol Maps
Graduated and proportional symbol maps scale the size of a chosen symbol—usually a circle, square, or bar—in direct proportion to the value of the data at a specific point. Unlike choropleth maps, which color entire regions, symbol maps place markers at specific geographic coordinates or within defined areas. This approach is highly effective for comparing quantitative data across distinct locations, such as the total population of major cities or the magnitude of earthquakes along a fault line.
Cartograms
A cartogram is a unique thematic map in which geographic areas are intentionally distorted, scaled, or resized to reflect a specific variable rather than physical landmass. For example, a world population cartogram might show India and China as massive landmasses, while geographically large but sparsely populated countries like Canada or Russia shrink dramatically. Cartograms are powerful visual tools for challenging geographic assumptions and emphasizing the human or economic weight of a dataset over sheer physical size.
Key Elements of a Thematic Map
Designing a cartographically sound thematic map requires careful attention to several core design elements. Without these components, a map risks being confusing, inaccurate, or misleading to the audience.
- The Base Map: This is the foundational layer that provides geographic context. It includes basic reference features like coastlines, major roads, and political borders. The base map should remain visually subtle so that it does not compete with the thematic data layered on top of it.
- The Map Title and Sub A clear, descriptive title is essential. It must immediately inform the viewer of what is being mapped, the geographic region covered, and the time period the data represents.
- The Legend: The legend is the decoder key for the map. It must clearly explain what each color, symbol, line, or shading pattern represents, including the specific units of measurement and data classification ranges used.
- Data Classification and Color Ramps: How data is grouped into classes (such as equal intervals or natural breaks) and the choice of color palettes (sequential, diverging, or qualitative) drastically alter how the map is interpreted. Proper classification ensures the visual narrative matches the statistical reality.
- Scale and Orientation: A scale bar helps the viewer understand distance and proportion, while a north arrow or compass rose establishes geographic orientation, ensuring the map remains a reliable spatial tool.
- Data Sources and Metadata: To establish credibility, every thematic map should cite its data sources. This allows viewers to verify the accuracy of the information and understand the methodology behind the visualization.
Applications of Thematic Maps
Thematic maps are utilized across a vast spectrum of professional and academic disciplines to solve real-world problems and guide strategic planning.
In public health and epidemiology, thematic maps are critical for tracking the spread of infectious diseases, identifying environmental health hazards, and locating underserved populations to optimize the distribution of healthcare resources.
In environmental science and resource management, researchers rely on these maps to monitor deforestation, track habitat fragmentation, analyze the effects of climate change on biodiversity, and manage water resources.
For urban planning and public policy, municipal governments use thematic maps to analyze demographic shifts, assess housing affordability, plan public transit routes, and determine the optimal placement of public infrastructure like schools, parks, and emergency services.
In the business and commercial sector, market analysts use thematic maps for site selection, target demographic profiling, supply chain optimization, and regional sales performance tracking, allowing companies to make data-driven investment decisions.
Advantages of Thematic Maps
The primary advantage of thematic maps is their ability to synthesize vast amounts of complex spatial data into an easily digestible visual format. They bridge the gap between abstract statistics and human perception, allowing viewers to recognize geographic patterns, anomalies, and trends in seconds—insights that might remain completely hidden in a standard spreadsheet or database.
Furthermore, thematic maps are highly versatile. They can represent almost any variable that has a spatial component, whether physical, social, or economic. By providing a clear spatial context, they serve as persuasive communication tools, helping advocates, scientists, and policymakers build compelling, evidence-based arguments that can drive public policy and community action.
Limitations of Thematic Maps
While thematic maps are incredibly powerful, they are not without limitations and can easily mislead viewers if poorly designed or misinterpreted. One major challenge is the Modifiable Areal Unit Problem (MAUP), which occurs when the aggregation of data into arbitrary administrative boundaries (like school districts or voting precincts) alters the apparent spatial patterns, potentially leading to incorrect conclusions.
Another limitation is classification bias. Depending on how an analyst divides continuous data into categories—such as using equal intervals versus quantiles—the visual representation of the map can change dramatically, sometimes exaggerating or downplaying critical trends.
Additionally, maps are subject to generalization. To maintain readability, complex spatial details must often be simplified, which inevitably results in a loss of precision. Viewers must always remain critical of the scale, data sources, and design choices behind any thematic map they encounter.
Tools and Software for Creating Thematic Maps
The democratization of technology has made the creation of thematic maps highly accessible, ranging from professional-grade software to user-friendly web platforms.
- Desktop GIS Software: Industry standards like Esri’s ArcGIS Pro and the open-source platform QGIS offer unparalleled power for spatial analysis, data manipulation, and advanced cartographic design.
- Business Intelligence and Data Visualization Tools: Platforms like Tableau and Microsoft Power BI feature robust, built-in spatial mapping capabilities, allowing analysts to easily link corporate databases to interactive thematic maps.
- Web-Based Mapping Platforms: Tools such as Mapbox, Carto, and Google Earth Studio allow users to create highly customized, interactive, and shareable web maps without requiring extensive background knowledge in traditional GIS.
- Programming Libraries: For data scientists and developers, libraries in Python (such as GeoPandas and Folium) and R (such as ggplot2 and sf) offer programmatic control over thematic map generation, enabling automated and highly reproducible spatial workflows.
FAQs: What is a Thematic Map?
What is the difference between a thematic map and a reference map?
A thematic map is designed to showcase a specific data theme or subject across a geographic area, focusing on patterns and distributions (such as average income or temperature zones). A reference map, on the other hand, focuses on showing the locations of general geographic features, such as roads, rivers, cities, and political boundaries, to aid in navigation and orientation.
Can thematic maps be used for historical data?
Yes, thematic maps are exceptionally well-suited for visualizing historical trends and changes over time. They can be used to illustrate historical population migrations, shifting geopolitical borders, the spread of historical epidemics, or the industrial development of regions across different eras.
What software is best for beginners to create thematic maps?
For beginners, QGIS is an excellent, free, open-source desktop option with a vast community support network. For those looking for simpler, more intuitive drag-and-drop interfaces without a steep learning curve, data visualization platforms like Tableau or web-based tools like Carto are highly recommended.
How do I choose the right type of thematic map for my data?
The choice depends on the nature of your data. If you are working with standardized data aggregated by administrative regions (like literacy rates by country), a choropleth map is often best. If your data is continuous across space (like elevation or temperature), use an isoline map. For discrete counts of occurrences (like crime locations), dot density or graduated symbol maps are ideal.
Are thematic maps only used in geography?
No, thematic maps are widely used across a broad range of industries and academic fields outside of traditional geography. They are essential tools in public health, business marketing, urban planning, environmental science, political campaign management, and journalism, among many others.