In the modern corporate ecosystem, bringing an expected staffing shortfall to the immediate attention of executive leadership is a fundamental operational necessity. However, a high-level forecast in isolation rarely tells decision-makers where a workforce gap is actually originating. When professionals face the task of explaining complex operational metrics, they frequently encounter the strong temptation to squeeze every available detail, trend line, and historical data point into a single, comprehensive chart.
This exact challenge recently came to the forefront during a custom client workshop conducted by Storytelling with Data. The participating team faced a multifaceted communication hurdle: they needed to demonstrate to leadership that full-time equivalent staffing levels were projected to fall significantly below the established annual plan. Simultaneously, they needed to highlight that a noticeable decline in operations support roles constituted a critical piece of the broader puzzle, ultimately prompting executives to discuss and determine a strategic approach to resolving the deficit.

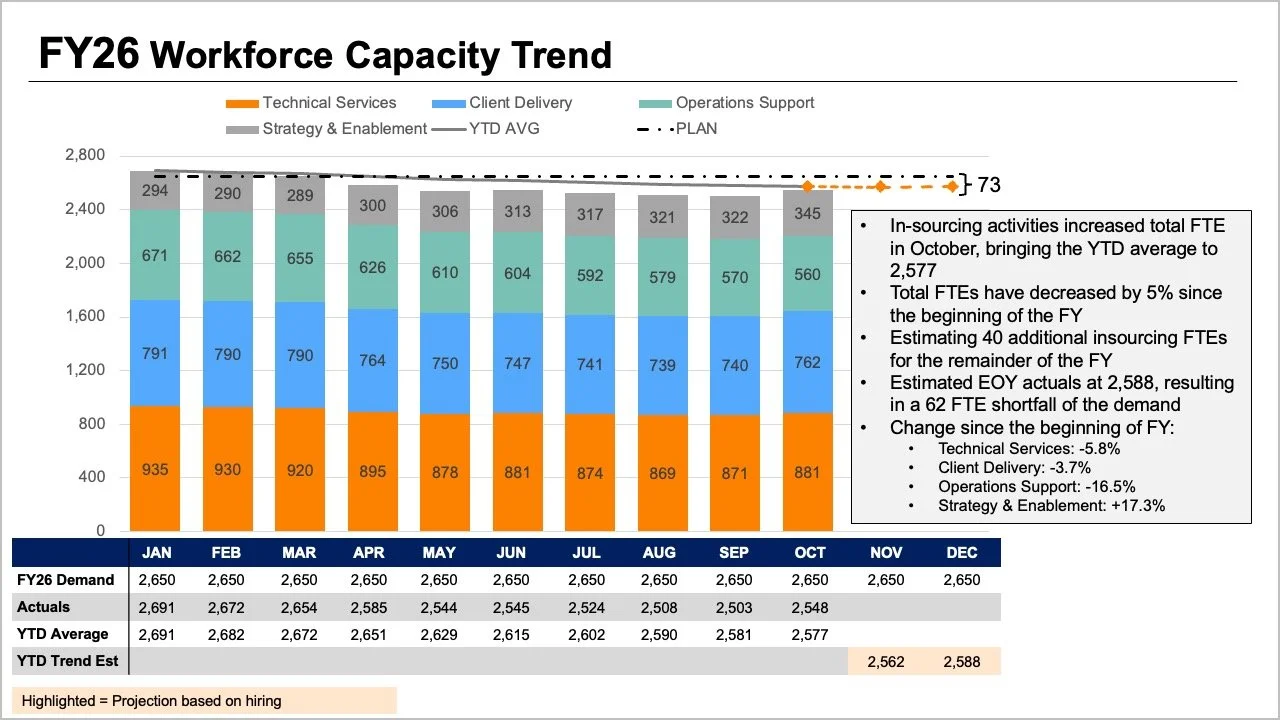
While all the crucial information was undeniably present in their initial reporting materials, the core narrative was effectively buried beneath layers of visual complexity. The original slide demanded that readers process multiple visual variables simultaneously. The tops of stacked bar charts, overlapping trend lines, and dense data tables attempted to convey overall full-time equivalent metrics in several different ways at once. Meanwhile, internal bar segments mapped out granular breakdowns by role, while plan figures, actual counts, year-to-date averages, and forward-looking projections piled on yet another interpretive layer.
Although each individual element answered a reasonable operational question, cramming them together into a single graphic made it remarkably difficult for leaders to extract clear answers to any single inquiry. Taking a step back to evaluate what executives actually need for high-stakes strategic conversations provides a much clearer roadmap for effective data visualization. Leadership generally requires direct answers to two primary questions: how large of a staffing shortfall should the organization anticipate, and what do the latest workforce trends reveal about where those changes are occurring? Rather than packing every available data point into one congested graph, the workshop strategy centered on splitting the information into two distinct, focused visuals.
Use a line chart for the overall trend
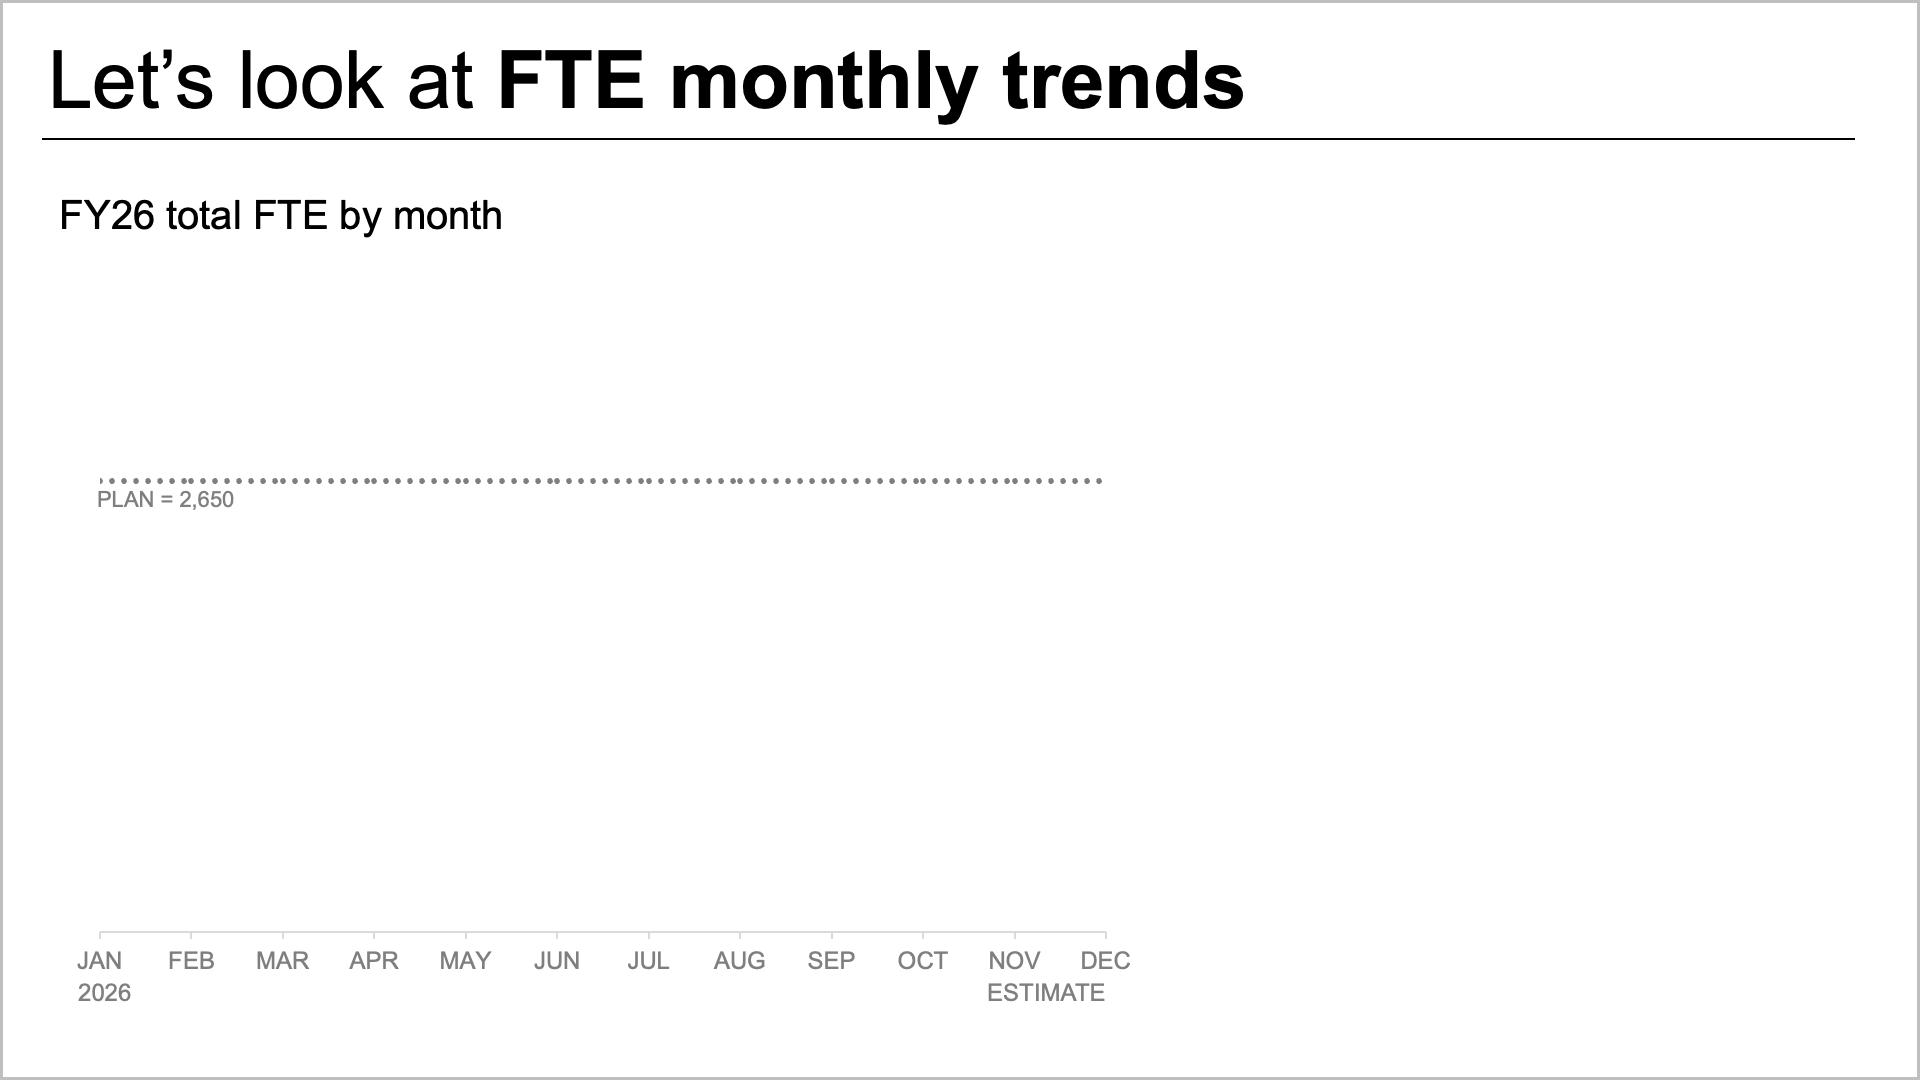
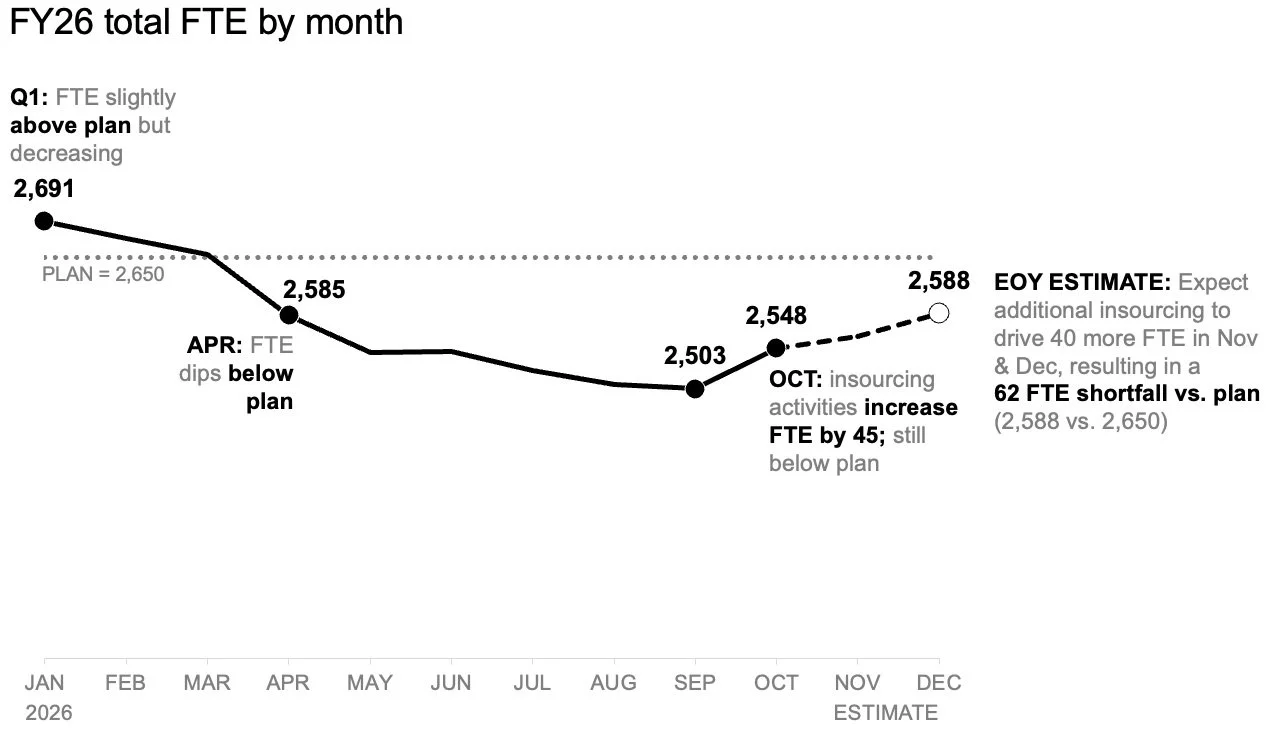
To tackle the anticipated staffing shortfall effectively, the first logical step involves establishing a standalone line chart. This dedicated view makes it significantly easier for management to see how workforce numbers have tracked against the strategic plan set at the beginning of the year, while clearly illustrating how upcoming projections compare to those original benchmarks.
By isolating the primary trend, the visual creates valuable empty space necessary for adding targeted annotations at critical inflection points. Readers can immediately focus on the expected gap relative to the plan without first needing to decode complex role mixes or scan through dense legacy data tables. The line chart efficiently answers the overarching macro question regarding overall trajectory, laying a solid foundation for more granular exploration.
Add a second view for the role-level breakdown
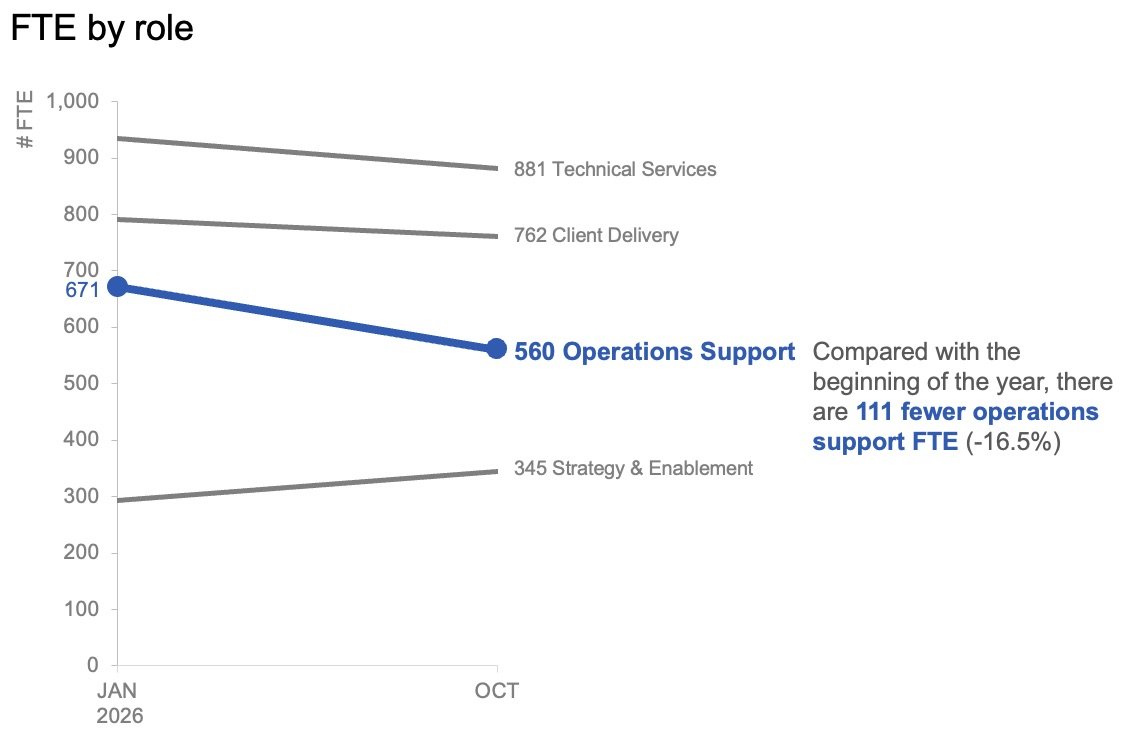
Once the overall view establishes the expected divergence from early-year targets, attention naturally shifts toward understanding the micro-level dynamics. To help leadership comprehend where the largest operational shifts have occurred, a second view focuses specifically on role-level changes within actual workforce data.
In this context, month-to-month operational noise matters far less than the overarching trajectory. Plotting only the start of the year alongside the latest actual month using a slopegraph provides an immediate, uncluttered sense of which specific roles have experienced the most substantial changes. By utilizing color and descriptive text very sparingly, the design naturally draws the audience’s attention toward the decline in operations support roles, ensuring executives instantly grasp the primary driver behind the broader staffing gap.
Together, these two distinct visuals function as a cohesive analytical pair. The line chart answers what is happening overall across the entire organization, while the slopegraph clarifies which specific job categories have shifted the most over the course of the reporting period.
Plan for how the story will be shared
Beyond the design of individual charts, the method of delivery dictates how successfully data communicates its core message. For corporate summaries that are frequently read or forwarded independently without a live presenter to guide the audience, placing both views together on a single page offers a streamlined experience.
Under this format, a clear takeaway slide title states the expected shortfall explicitly, while supporting explanatory text points directly to the decline in operations support roles and signals the urgent need for leadership to debate next steps. The charts provide robust empirical evidence without competing aggressively for the same visual space.
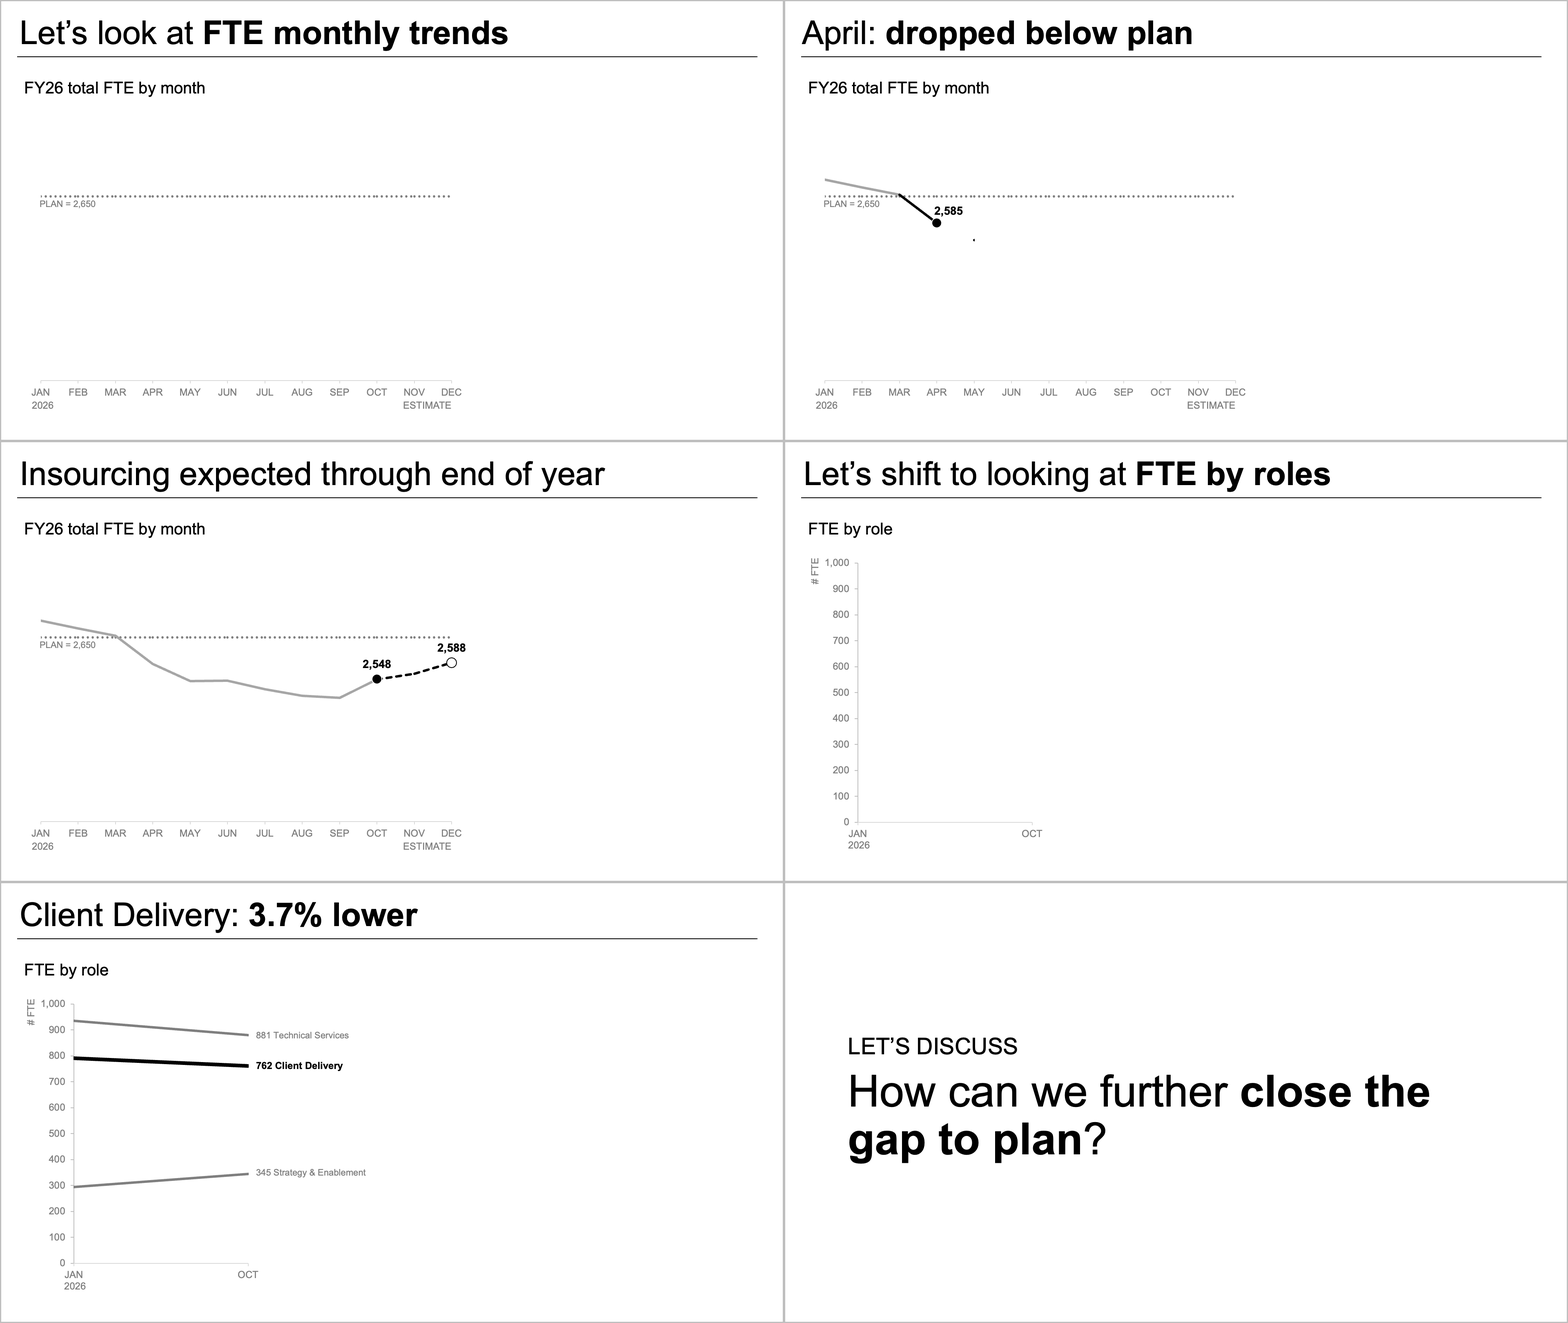
Conversely, during a live presentation setting, the exact same underlying data can be deployed through a more paced narrative sequence. Rather than asking an audience to absorb an entire multi-faceted summary all at once while a speaker talks over the slide, presenters can walk through the macro forecast first. They can then reveal the actual role-level changes piecewise, and finally steer the discussion toward actionable next steps. This deliberate sequencing allows the audience to fully digest one conceptual point before transitioning to the next.
While the underlying data and the core message remain entirely unchanged, the deliberate pacing fundamentally alters how much cognitive load is placed on the audience at any given moment. When complex operational landscapes demand detailed explanation, the innate temptation is always to consolidate everything into a single, unified view under the banner of efficiency. Yet, organizational experience consistently demonstrates that accumulating more raw information on a single slide does not automatically generate higher levels of understanding. By separating overarching staffing trends from granular role-level shifts, both distinct insights become radically easier to interpret, ultimately equipping leadership with a focused, actionable narrative built on clarity and precision.