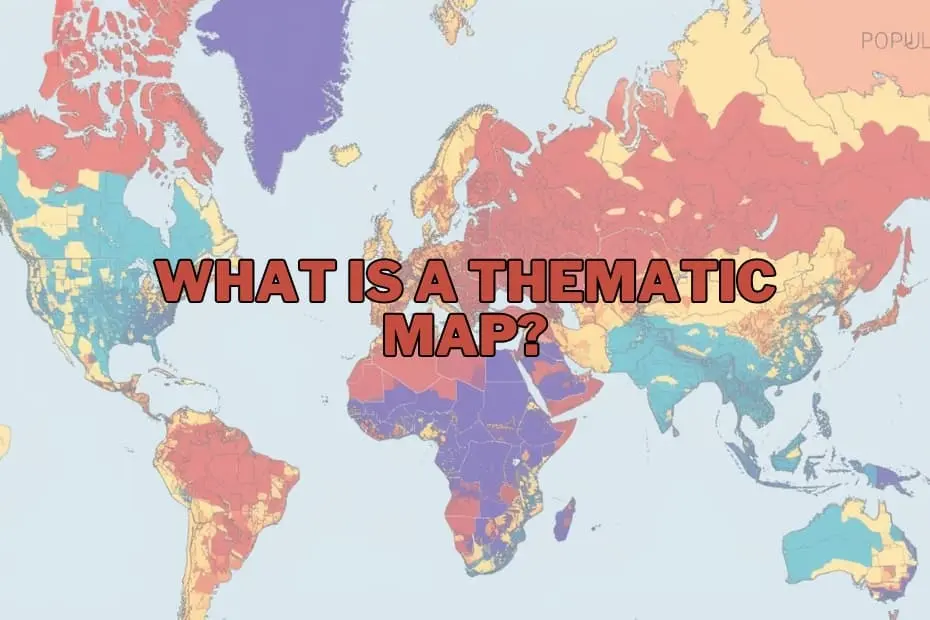
In an era dominated by big data, the challenge is no longer just gathering information, but making sense of it. Across industries—from urban planning and public health to environmental science and corporate marketing—decision-makers are constantly searching for ways to convert abstract numbers into actionable insights. Within the realm of geography and data visualization, maps have evolved far beyond their traditional role as mere tools for navigation. Today, they serve as powerful instruments for storytelling, uncovering hidden patterns, and illuminating complex spatial relationships.
Among the diverse cartographic tools available, the thematic map stands out as an invaluable resource for visualizing data in a meaningful way. Unlike standard road maps that guide travelers from one physical location to another, thematic maps are designed to show the geographic distribution of specific concepts, trends, and statistics.
Defining the Thematic Map: A Specialized Tool for Data Analysis
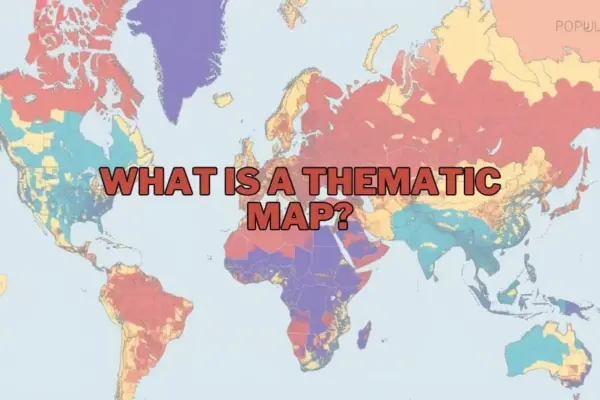
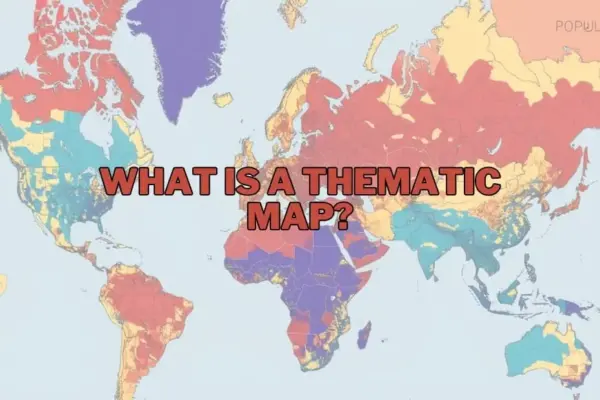
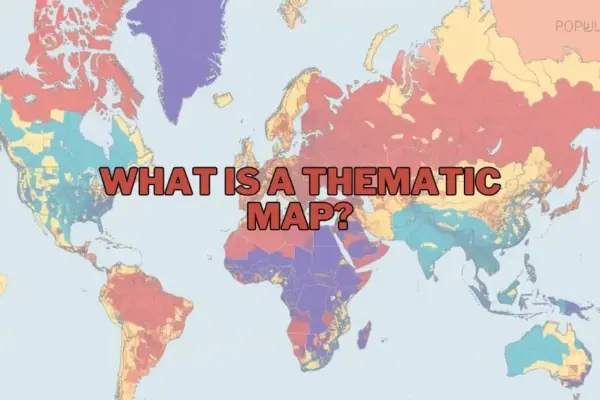
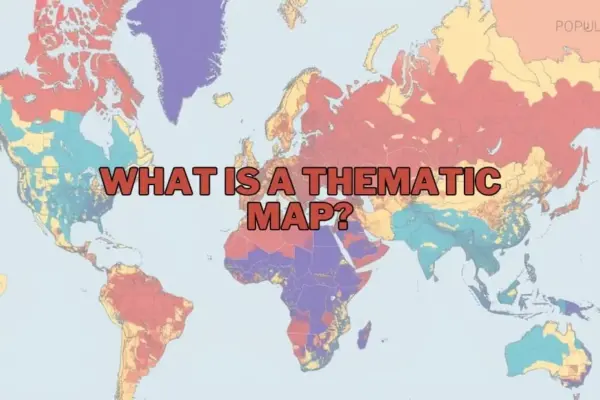
A thematic map is a specialized map designed to visually represent data related to a specific theme or subject, such as population density, climate patterns, or economic activity. While general reference maps focus on displaying primary geographic features—such as roads, coastlines, political boundaries, and cities—thematic maps prioritize a chosen subject, using the underlying geography merely as a canvas to display spatial distributions and trends.
By using colors, symbols, shading, and structural distortions, thematic maps make it simple to spot trends, clusters, and outliers that would otherwise remain buried in dense spreadsheets. They act as essential tools for geographers, researchers, and policymakers, transforming raw statistical data into intuitive visual narratives. For instance, while a spreadsheet might list the annual rainfall of a hundred different districts, a thematic map can instantly show how precipitation varies across an entire continent, highlighting areas facing severe drought or excessive rainfall.
The Purpose and Societal Importance of Thematic Maps
The primary purpose of a thematic map is to communicate complex spatial data quickly and effectively. In a world where visual communication is paramount, these maps help analysts and the public alike understand relationships and distributions that might otherwise go completely unnoticed.
For example, in the study of environmental science, a thematic map can illustrate exactly how climate change impacts regional agricultural productivity by overlaying temperature anomalies with crop yield data. In urban planning, mapping population growth alongside public transit routes can reveal where infrastructure is failing to meet demand.
The true importance of thematic maps lies in this ability to simplify the complex. Whether utilized by a student researching socio-economic disparities, a business analyst identifying untapped regional markets, or a government official allocating public health resources, thematic maps provide clear, actionable insights. By grounding abstract data in geographic reality, they foster a deeper understanding of how our physical world shapes human activity and natural phenomena.
Types of Thematic Maps: Choosing the Right Visual Approach
Different types of data require different cartographic techniques. To tell a compelling and accurate story, cartographers and data analysts rely on several distinct types of thematic maps, each suited to specific variables and analytical goals:
Choropleth Maps
Perhaps the most common type of thematic map, the choropleth map uses progressive color shading, patterns, or gradients within predefined administrative boundaries—such as counties, states, or countries—to represent categorized data values. Choropleth maps are highly effective for showing density, percentages, or average values, such as per capita income or voter turnout. However, cartographers must use them carefully, as they can sometimes imply that a variable is uniformly distributed across an entire region when local variations actually exist.
Isoline (Isarithmic) Maps
Isoline maps connect points of equal value with continuous lines, creating a smooth visual transition across geographic space. This style is ideal for representing continuous phenomena that do not conform to artificial political boundaries. Common examples include topographic contour maps showing elevation, isotherms showing temperature distribution, and isobars displaying atmospheric pressure.
Dot Density Maps
In a dot density map, individual dots are placed within a geographic area to represent the presence or quantity of a specific phenomenon. Each dot can represent a single occurrence (such as a recorded crime) or a specified quantity (such as one dot representing 1,000 residents). This method provides an intuitive, immediate visual sense of population concentration, clustering, and dispersion without relying on artificial administrative shading.
Proportional and Graduated Symbol Maps
These maps use symbols—most commonly circles—that vary in size according to the magnitude of the data at specific locations. Unlike choropleth maps, which shade entire areas, proportional symbol maps place the symbol over a specific point (such as a city or a factory). This approach is highly effective for displaying raw quantities, such as the total population of major urban centers or the volume of cargo handled by international ports.
Cartograms
A cartogram is a unique thematic map that intentionally distorts geographic shape and size to reflect a specific variable. For example, in a world population cartogram, countries with massive populations like India and China are visually enlarged to dominate the map, while geographically vast but sparsely populated nations like Canada and Australia are shrunk to small slivers. Cartograms are powerful conceptual tools that challenge traditional geographic perceptions to emphasize socio-economic realities.
Key Elements of an Effective Thematic Map
Creating a thematic map that is both visually striking and scientifically accurate requires careful attention to several key cartographic elements. Without these foundational components, a map risks confusing the audience or, worse, spreading misinformation:
- The A clear, descriptive title is essential. It must immediately inform the viewer of what variable is being mapped, the geographic region covered, and the time period of the data.
- The Legend: The legend is the key to decoding the map. It defines what each color gradient, symbol size, line type, or dot represents, ensuring the visual variables are translated accurately into numerical values.
- Map Scale and Orientation: While sometimes simplified on thematic maps compared to reference maps, scale bars and north arrows help ground the viewer, providing a sense of physical distance and geographic direction.
- Data Sources and Metadata: Credibility is vital in data visualization. Citing the source of the data (such as census bureaus, environmental agencies, or academic studies) allows viewers to verify the map’s accuracy and understand its scientific context.
Real-World Applications Across Diverse Fields
Thematic maps are not confined to geography classrooms; they are actively used across a broad spectrum of professional disciplines to drive decision-making:
- Public Health and Epidemiology: Health officials map disease outbreaks, vaccination coverage, and access to medical facilities to identify vulnerable communities, allocate resources, and track the spread of infectious diseases.
- Urban Planning and Demographics: Cities use demographic maps to plan zoning, determine where to build new schools or parks, and design efficient public transportation networks based on population density.
- Environmental Conservation: Conservationists map deforestation rates, wildlife migration corridors, and pollution levels to design protected areas and monitor the health of ecosystems.
- Business Intelligence and Marketing: Corporations utilize thematic maps to analyze customer demographics, evaluate competitor locations, and identify promising regional markets for expansion.
Advantages and Limitations of Thematic Mapping
Like any analytical tool, thematic maps come with distinct advantages as well as inherent limitations that creators and viewers must keep in mind.
Advantages
The primary benefit of thematic maps is their ability to make complex spatial data immediately digestible. They allow viewers to see the "big picture" at a single glance, highlighting regional inequalities, spatial clusters, and environmental trends that would take hours to decipher from raw text or tables. Additionally, they facilitate comparison, enabling researchers to overlay different thematic datasets to discover potential correlations, such as mapping industrial emissions alongside rates of respiratory illness.
Limitations
Despite their power, thematic maps can sometimes mislead. If the data boundaries are poorly chosen, or if the color schemes are biased, a map can distort the reality of a situation. For instance, choropleth maps can make large, sparsely populated rural areas appear disproportionately important simply because they occupy more physical space on the page. Furthermore, thematic maps are entirely dependent on the quality of the underlying data; inaccurate, outdated, or incomplete datasets will inevitably produce flawed visualizations.
Modern Tools and Software for Creating Thematic Maps
The democratization of technology has made the creation of thematic maps highly accessible. Today, a wide range of powerful software tools exists to help researchers, students, and businesses build their own visualizations:
- QGIS: A highly popular, free, and open-source Geographic Information System (GIS) that offers robust mapping and spatial analysis capabilities for users of all skill levels.
- ArcGIS: Developed by Esri, ArcGIS is the industry-standard commercial GIS software suite, widely used by governments, academic institutions, and corporations for advanced spatial modeling and enterprise-level mapping.
- Tableau: A leading business intelligence and data visualization platform that features intuitive, drag-and-drop mapping tools, allowing users to quickly convert spreadsheets into interactive, web-friendly thematic maps.
By combining these advanced digital tools with solid cartographic principles, anyone can transform static numbers into dynamic, visual stories that inspire action and drive meaningful change.
FAQs: What is a Thematic Map?
What is the difference between a thematic map and a reference map?
Thematic maps are designed to highlight a specific data theme or subject—such as population density, climate patterns, or economic statistics—across a geographic area. In contrast, reference maps focus on displaying general geographic features like roads, rivers, political boundaries, and landforms, primarily for navigation and spatial orientation.
Can thematic maps be used for historical data?
Yes, thematic maps are excellent tools for historical analysis. They can be used to visualize trends over time, such as shifts in population demographics, changes in political borders, the spread of historical epidemics, or changes in land use over decades.
What software is best for beginners to create thematic maps?
For beginners, QGIS is a highly recommended free, open-source platform with a wealth of online tutorials. Tableau is also an excellent, user-friendly option for those looking to quickly create interactive business-oriented maps without a steep learning curve.
How do I choose the right type of thematic map for my data?
The choice depends entirely on the nature of your data. Continuous data that changes gradually across space (like temperature or elevation) is best represented using isoline maps. Categorical data or average values bound by administrative borders (like average income by state) are ideal for choropleth maps. Raw quantities at specific points (like city populations) are best shown using proportional symbols.
Are thematic maps only used in geography?
No, thematic maps are widely utilized across a variety of fields outside of traditional geography, including public health, urban planning, environmental science, market research, sociology, and political science.